

The most consequential transformation in modern finance isn't happening on exchange floors or in quarterly earnings calls. It's occurring in boardrooms, pitch decks, and term sheets—places where most investors will never gain access.
Over the past two decades, the geography of value creation has fundamentally shifted. Companies that once needed public markets to scale now bypass them entirely, capturing their most explosive growth years behind closed doors. What began as a post-crisis anomaly has crystallized into a permanent structural change in how capital flows, how companies mature, and where wealth compounds.
For institutional allocators, founders, and anyone building long-term portfolios, this isn't background noise. It's the defining investment reality of our era.
When Public Markets Ruled
There was a time when going public meant something different.
Throughout the 1980s and 1990s, initial public offerings represented the starting gun for serious growth. Companies went public young—often within four to six years of founding—and used capital markets to finance their expansion. Microsoft went public six years after its founding. Amazon, four years. Google held out longer at six years, but still entered public markets while much of its value creation lay ahead.
Retail investors could buy shares in these companies while they were still shaping their industries. Public equity markets served as the primary engine for funding innovation at scale, and the wealth generated from that innovation was broadly accessible. The public-private boundary was porous, and crossing it early was standard practice.
That world no longer exists.
 US IPO Volume: Shows the dramatic volatility in the number of IPOs, with clear peaks during the dot-com bubble (1999-2000), COVID recovery (2020-2021), and the sharp collapse in 2022-2023.
The Inflection Point: How 2008 Rewired Capital
The global financial crisis didn't just reshape banking and monetary policy. It fundamentally altered the architecture of how companies access growth capital.
Central banks flooded the system with liquidity. Interest rates collapsed and stayed low for over a decade. Institutional investors—pension funds, sovereign wealth funds, endowments—began searching desperately for returns in a zero-rate environment. Private markets, with their promise of illiquidity premiums and alpha generation, became the answer.
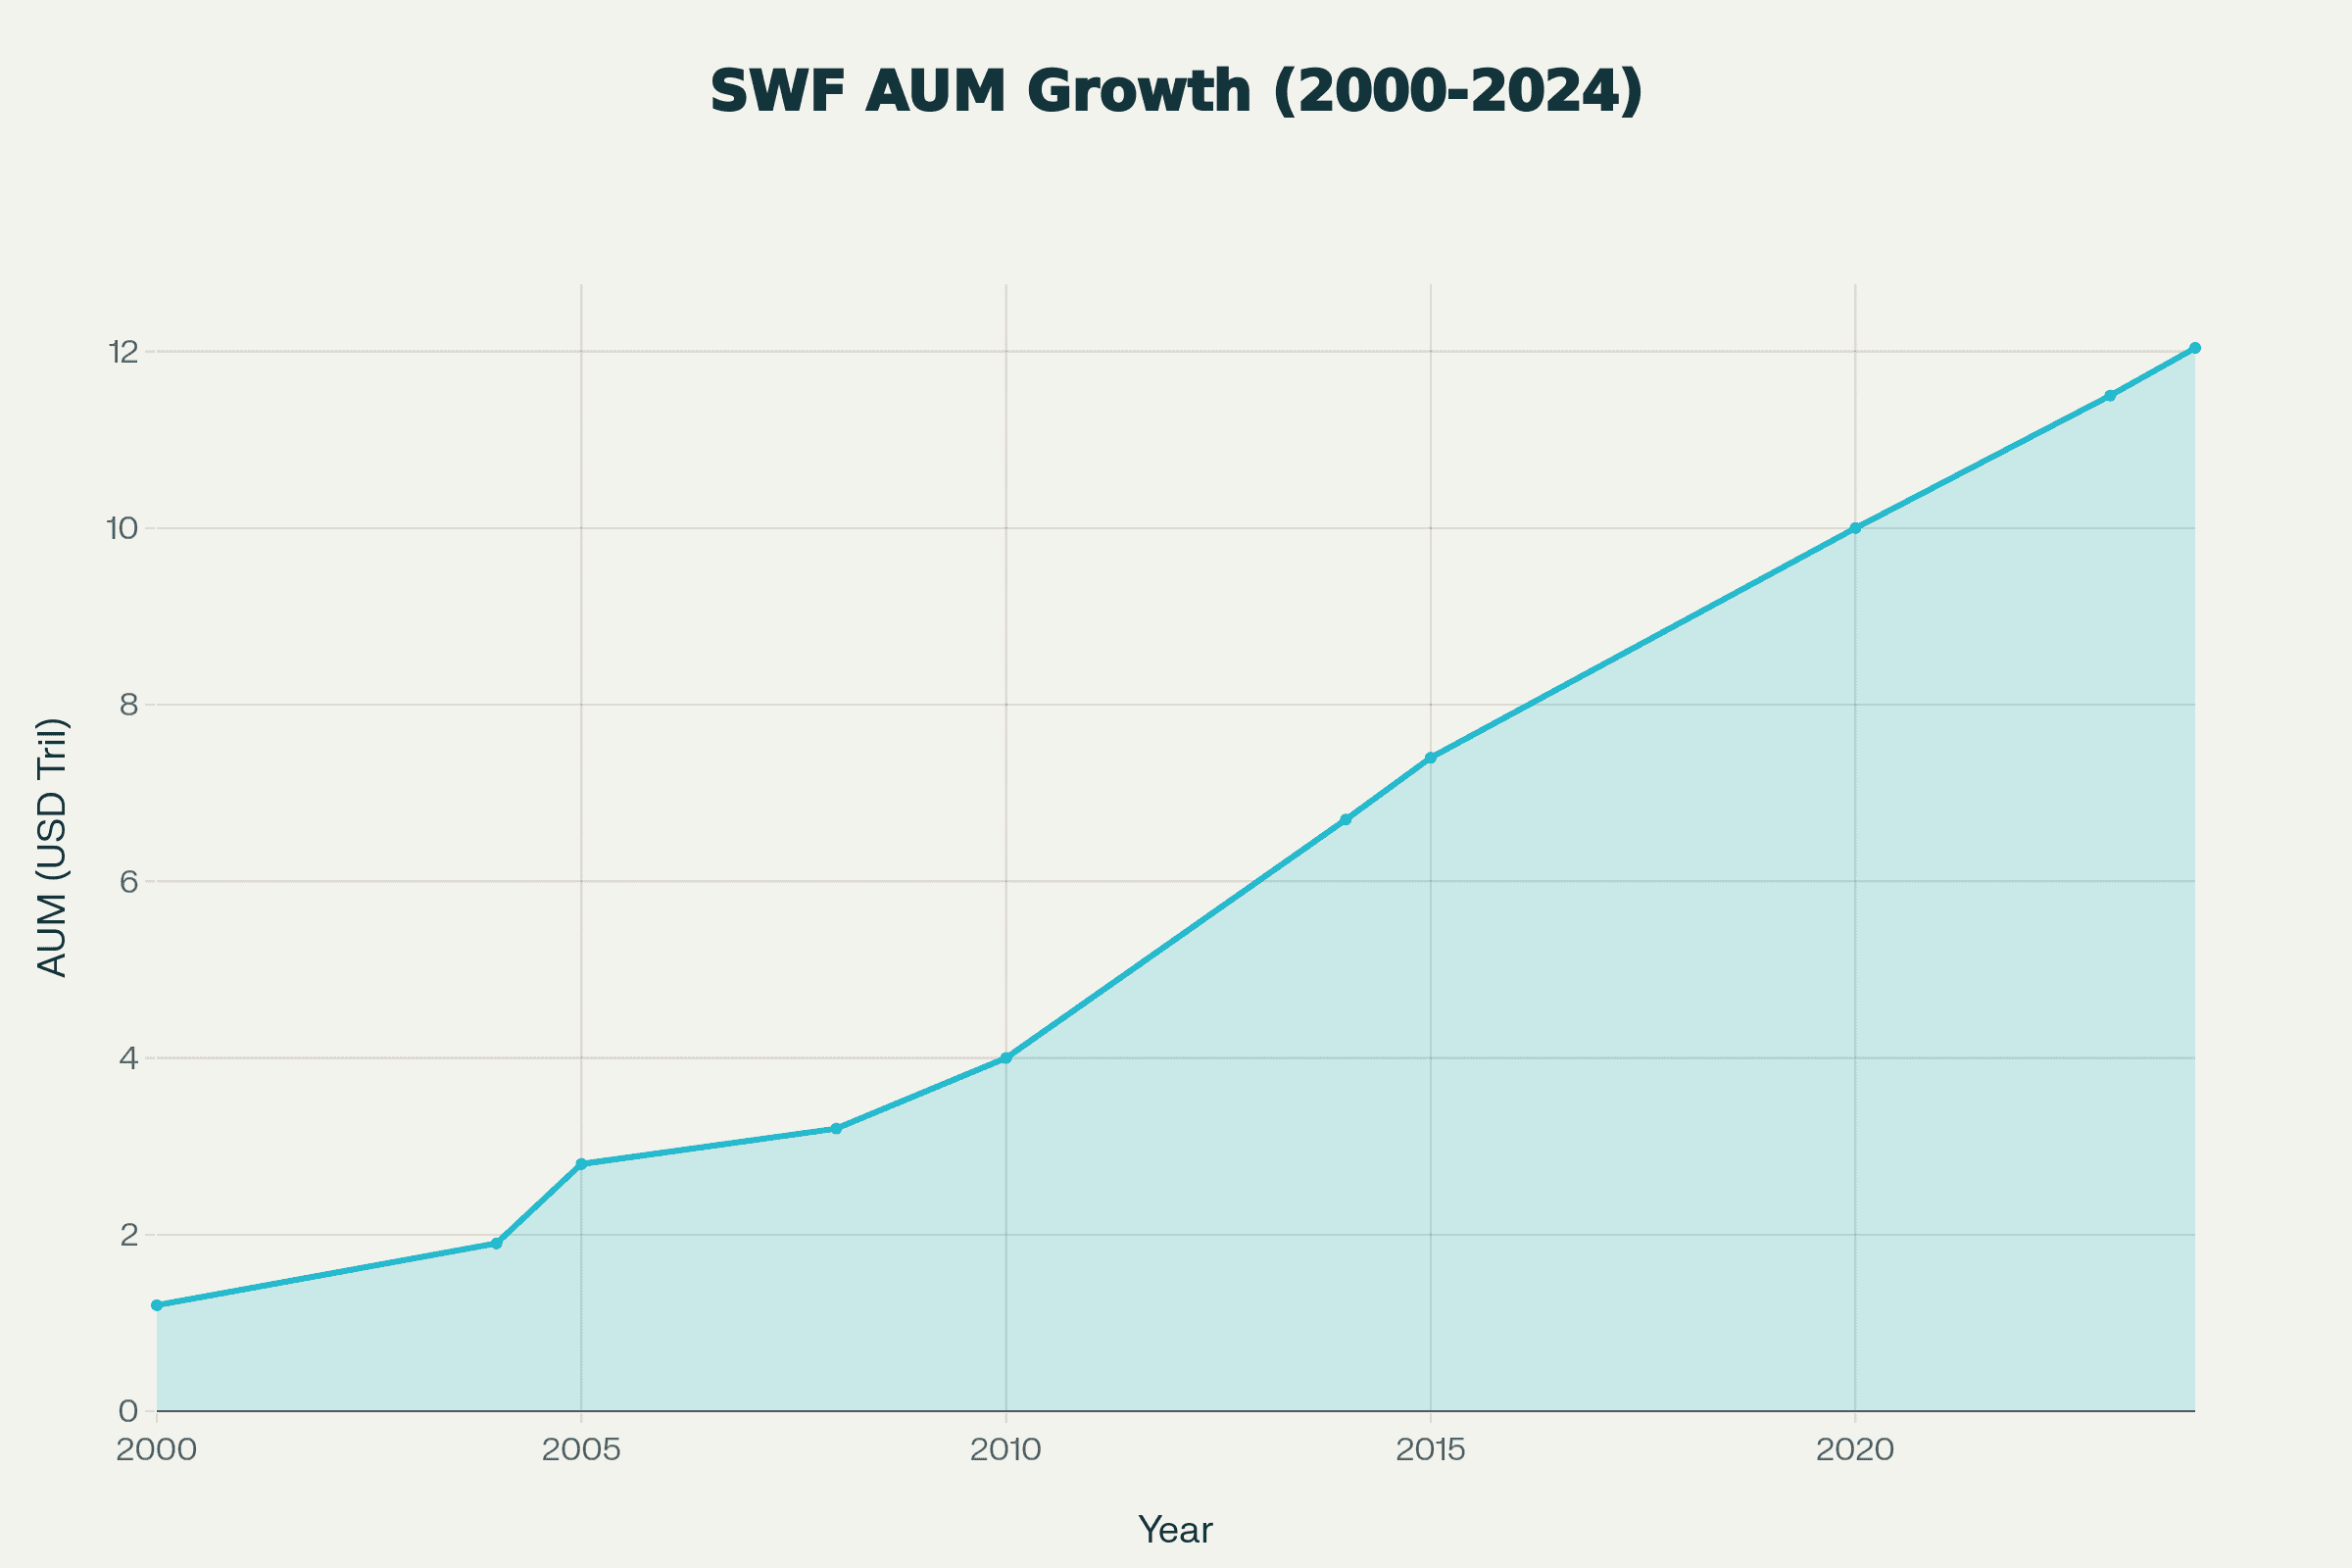 Growth trajectory of global sovereign wealth fund assets under management from 2000 to 2024, showing a 10-fold increase from $1.2 trillion to over $12 trillion
Simultaneously, regulatory changes made being public more expensive and operationally burdensome. Sarbanes-Oxley had already increased compliance costs, but the post-crisis environment intensified scrutiny. Quarterly earnings pressure, disclosure requirements, and the short-term focus of public markets made staying private increasingly attractive.
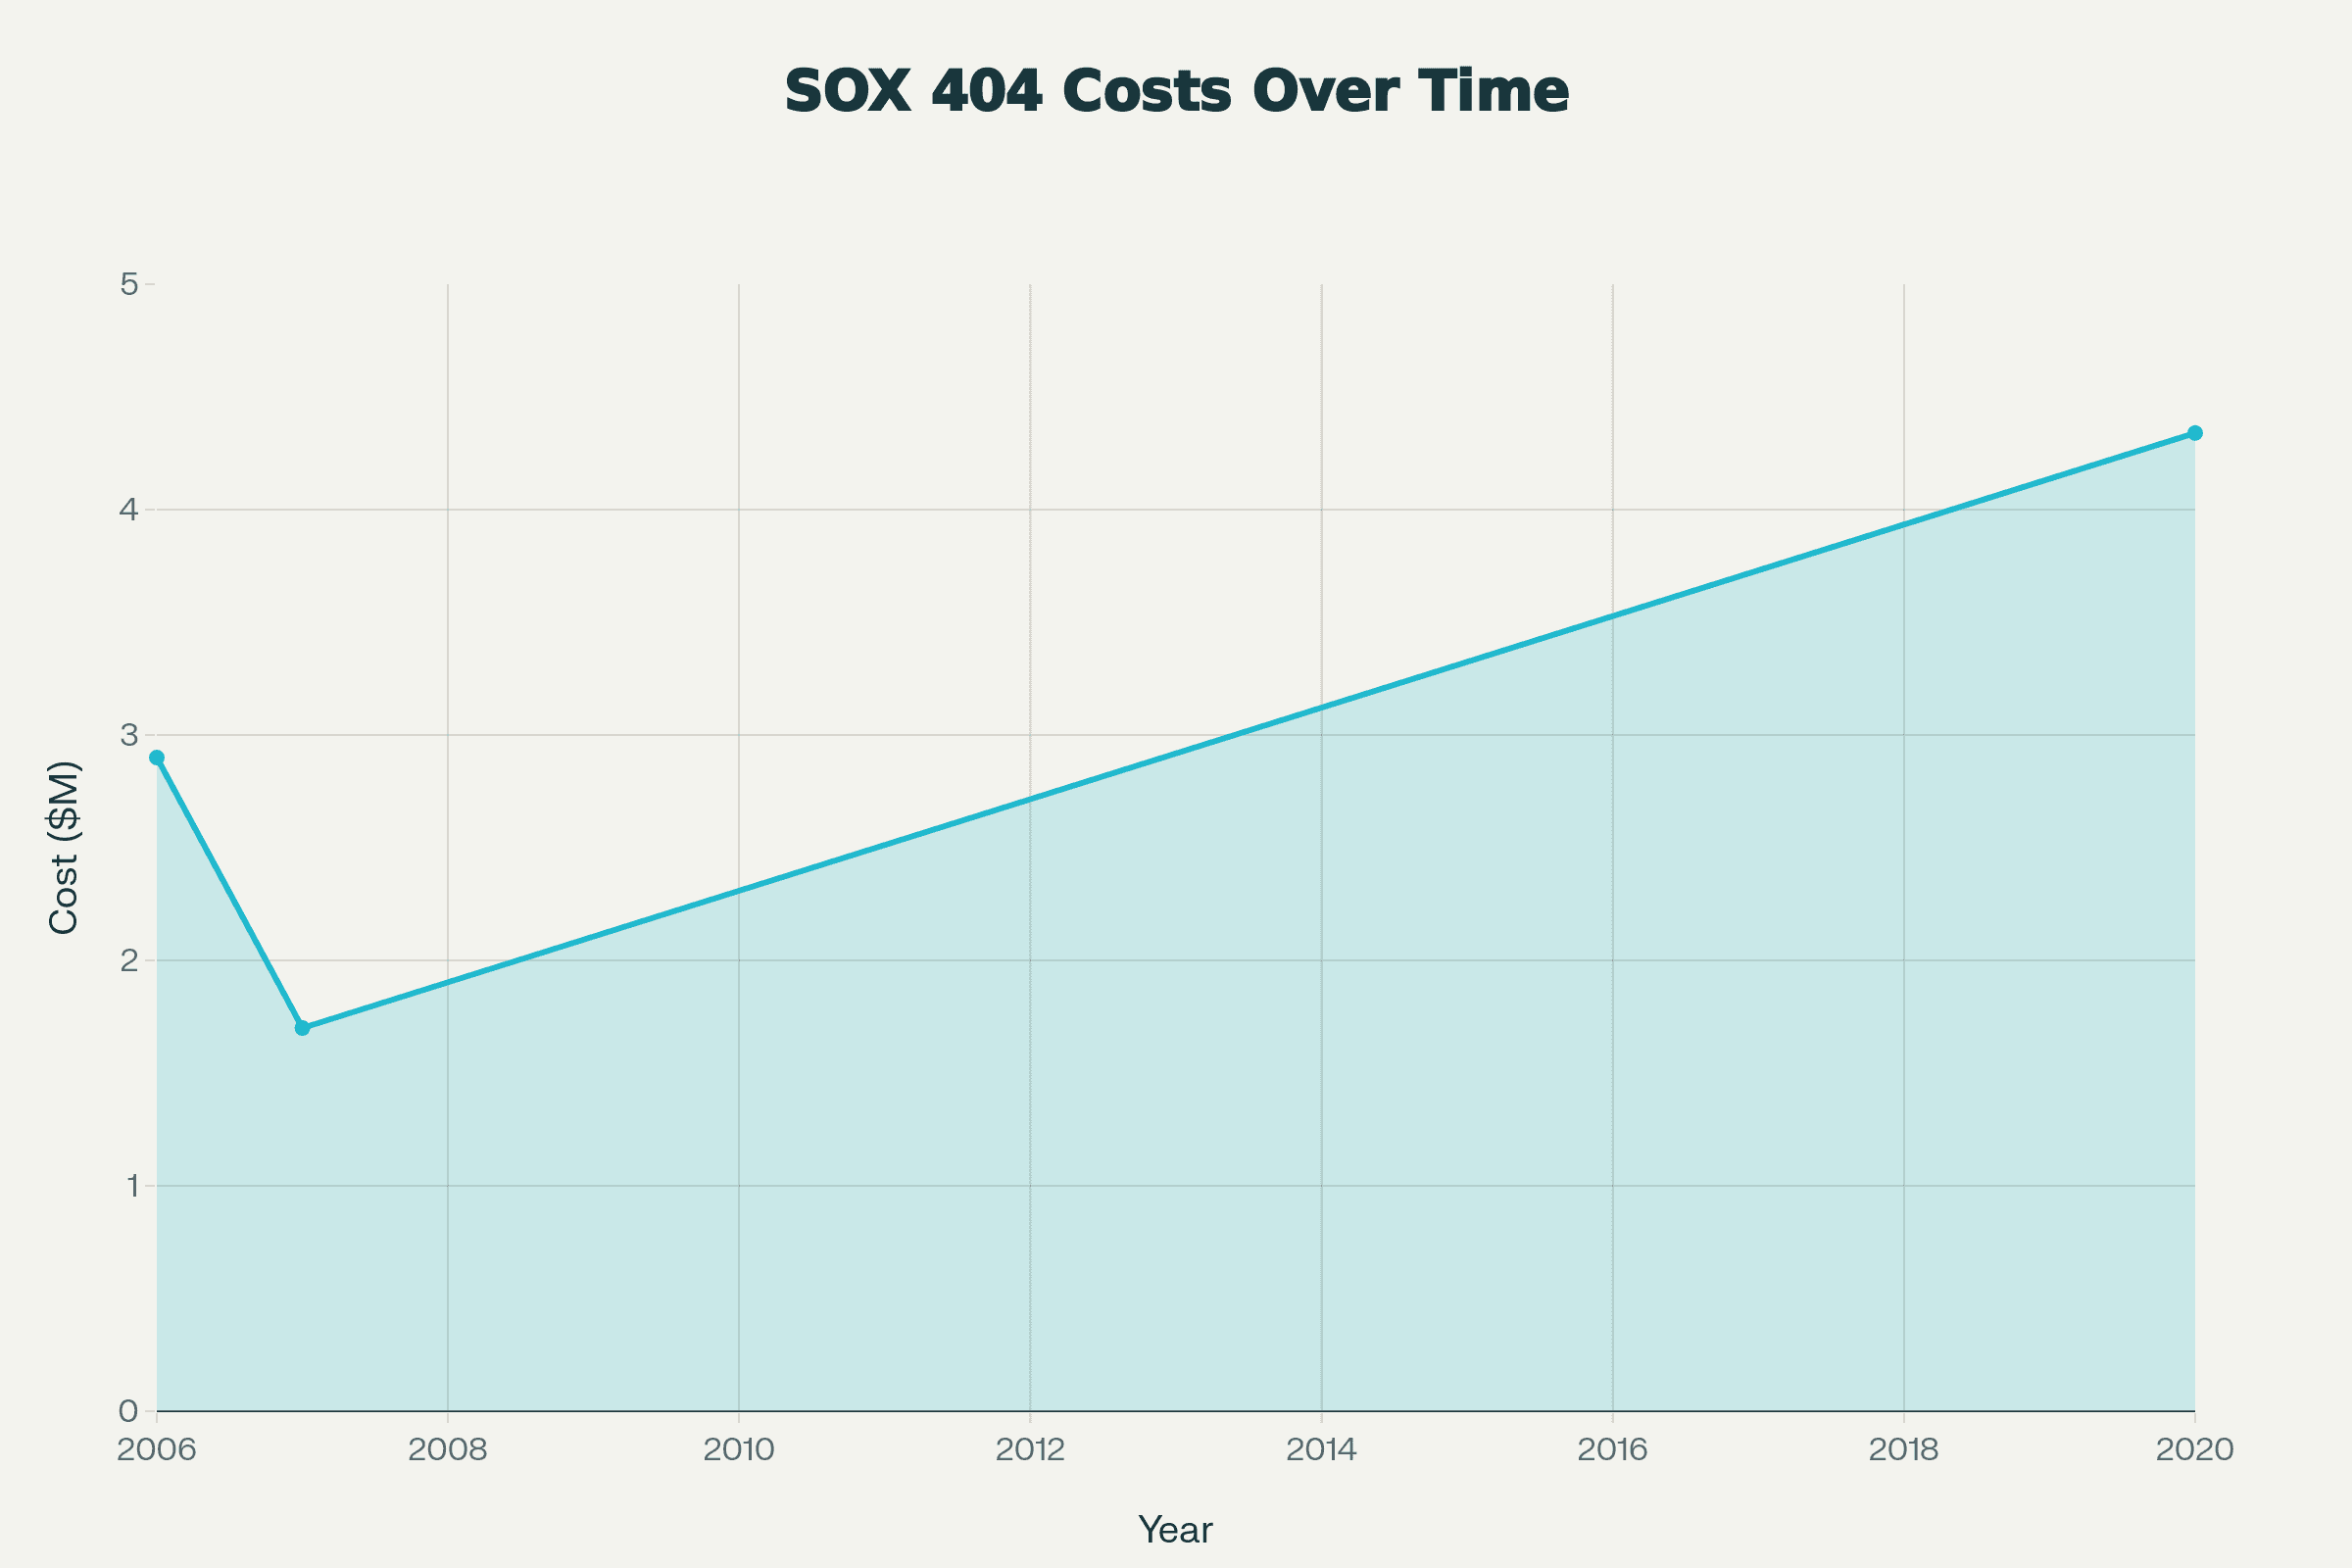 Sarbanes-Oxley Section 404 Compliance Costs Trend (2006-2020)
The result: companies began staying private longer. Much longer. By the mid-2010s, the average age of a company at IPO had stretched from six years to eleven years. Today, many category-defining companies remain private for twelve to fifteen years—or don't go public at all.
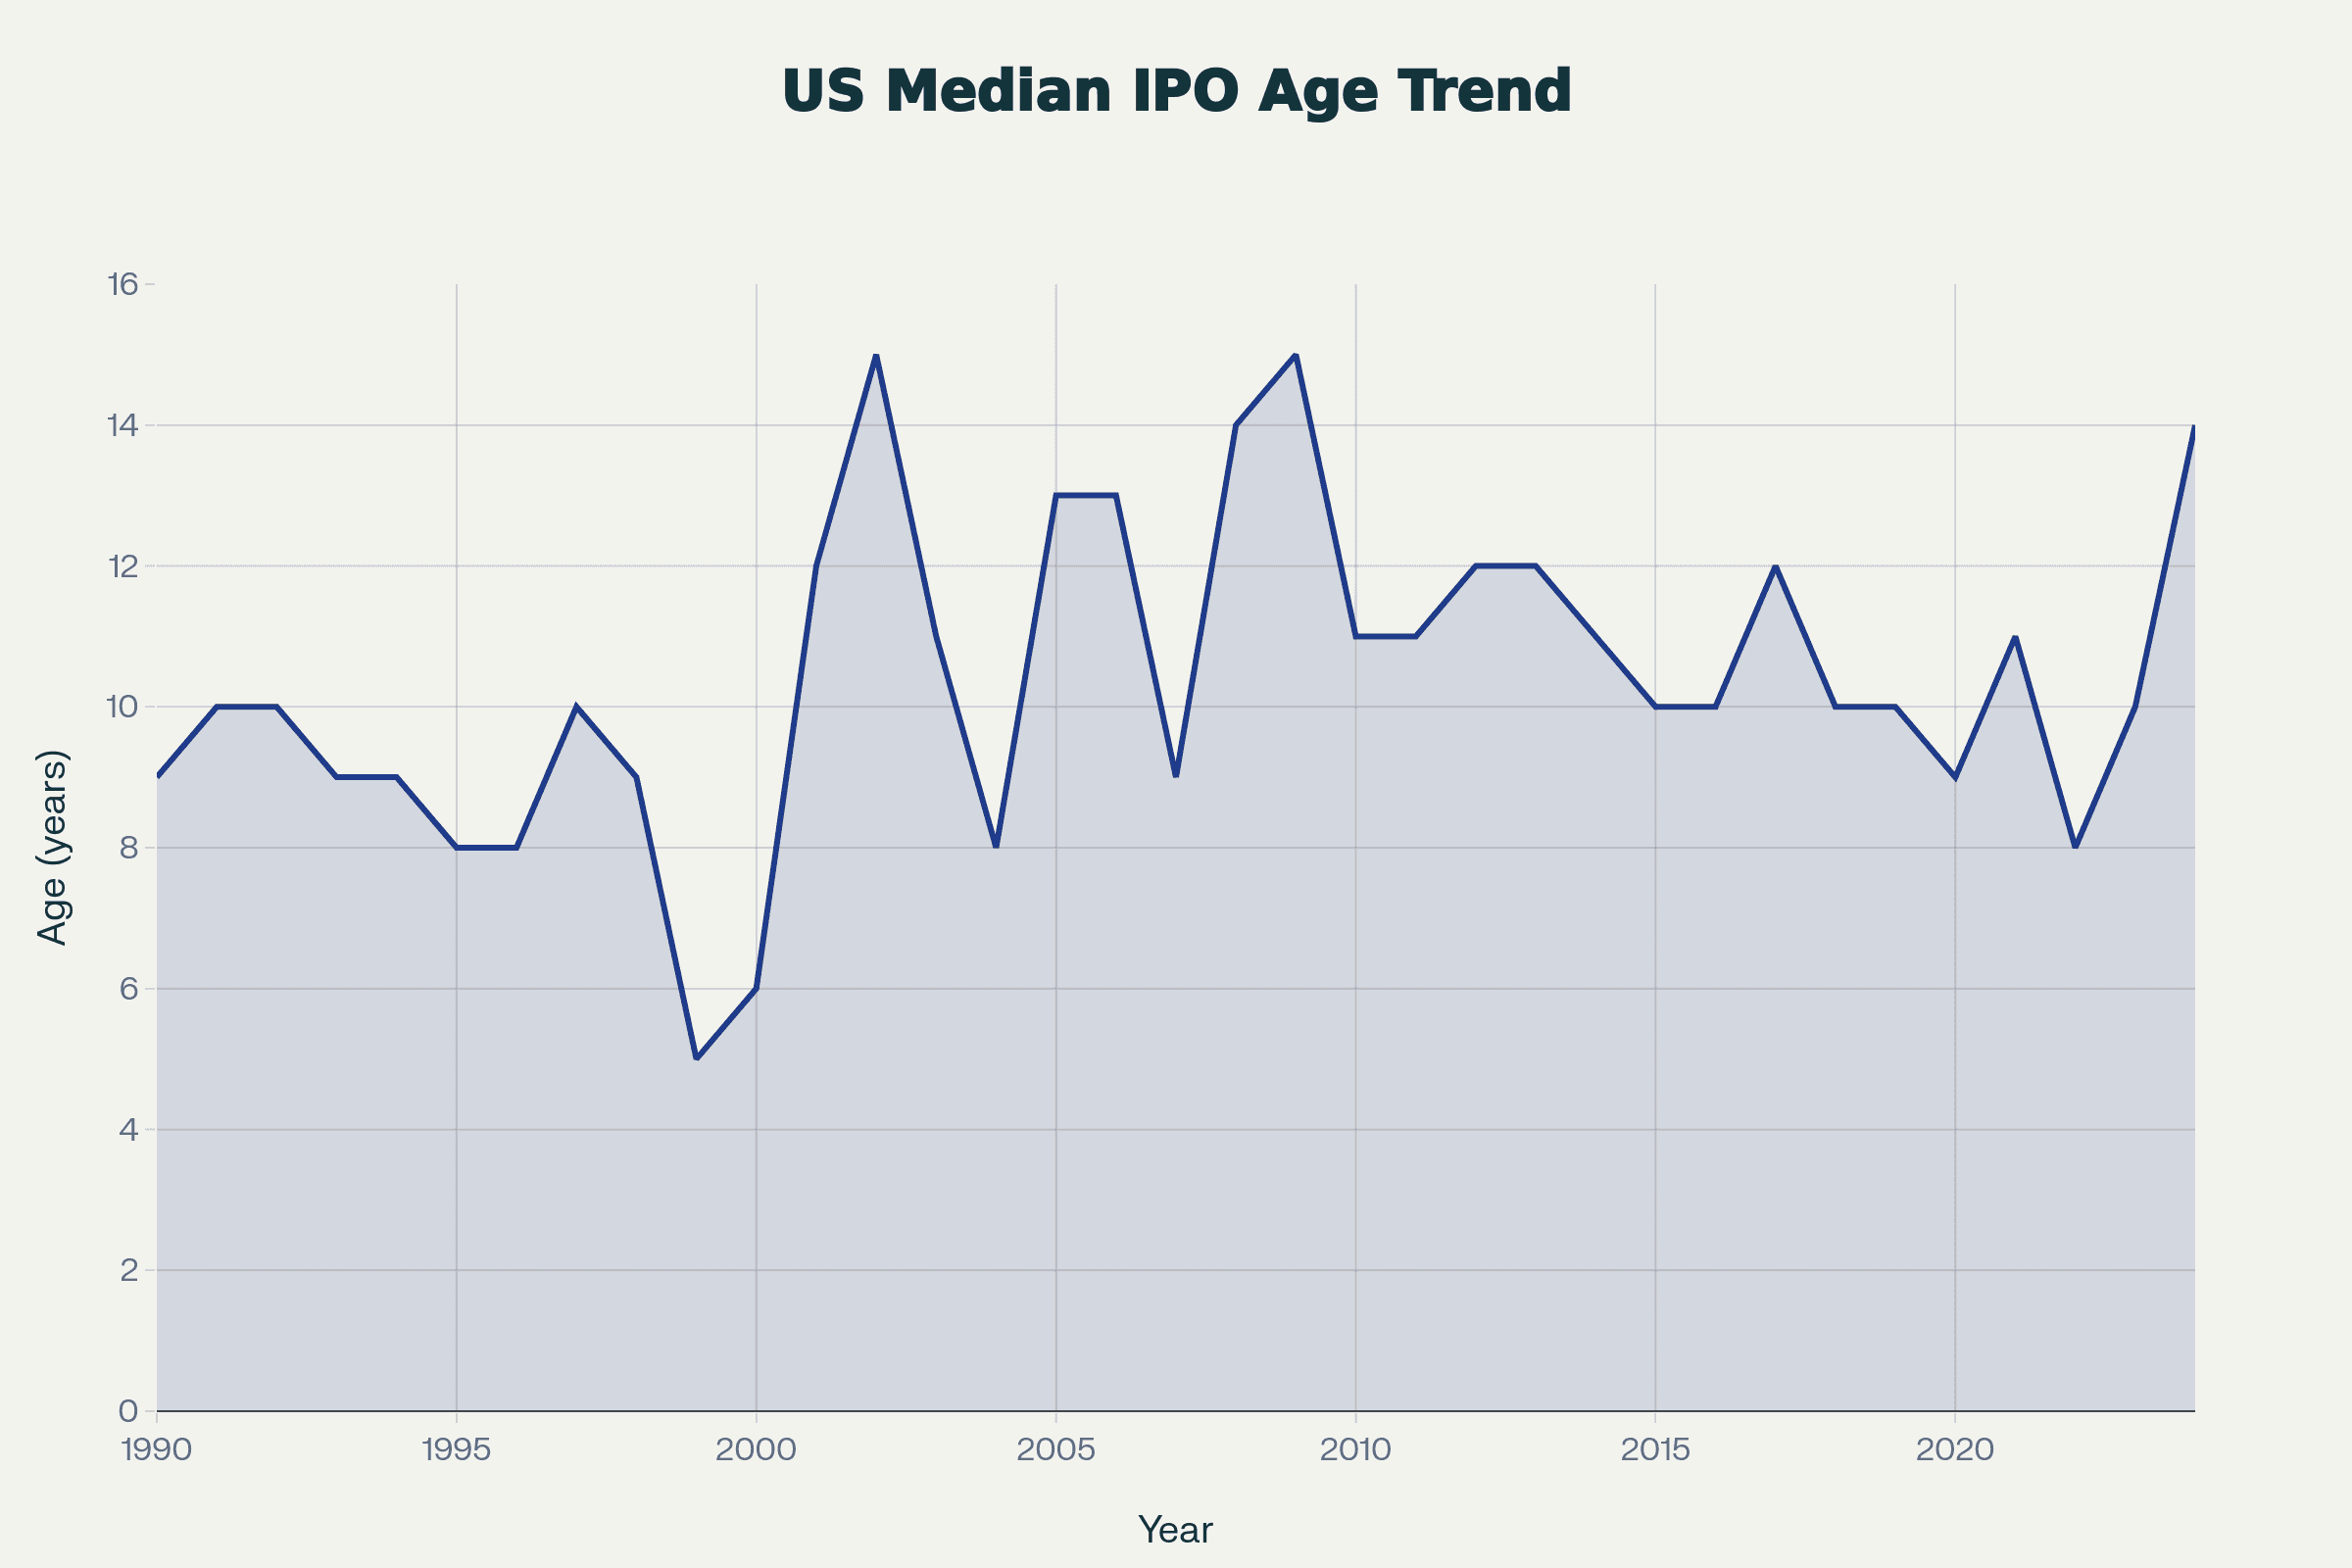 Median Age of Companies at IPO: United States (1990–2024)
The Structural Drivers That Made This Permanent
This isn't a cyclical shift that will reverse when rates normalize or market conditions change. Five structural forces have permanently relocated value creation from public to private markets.
The Private Capital Machine
Private equity assets under management have grown from $1.2 trillion in 2005 to over $13 trillion today. Venture capital, growth equity, and private credit have experienced similar exponential growth. Sovereign wealth funds now manage more than $12 trillion in assets, with significant portions allocated to private investments.
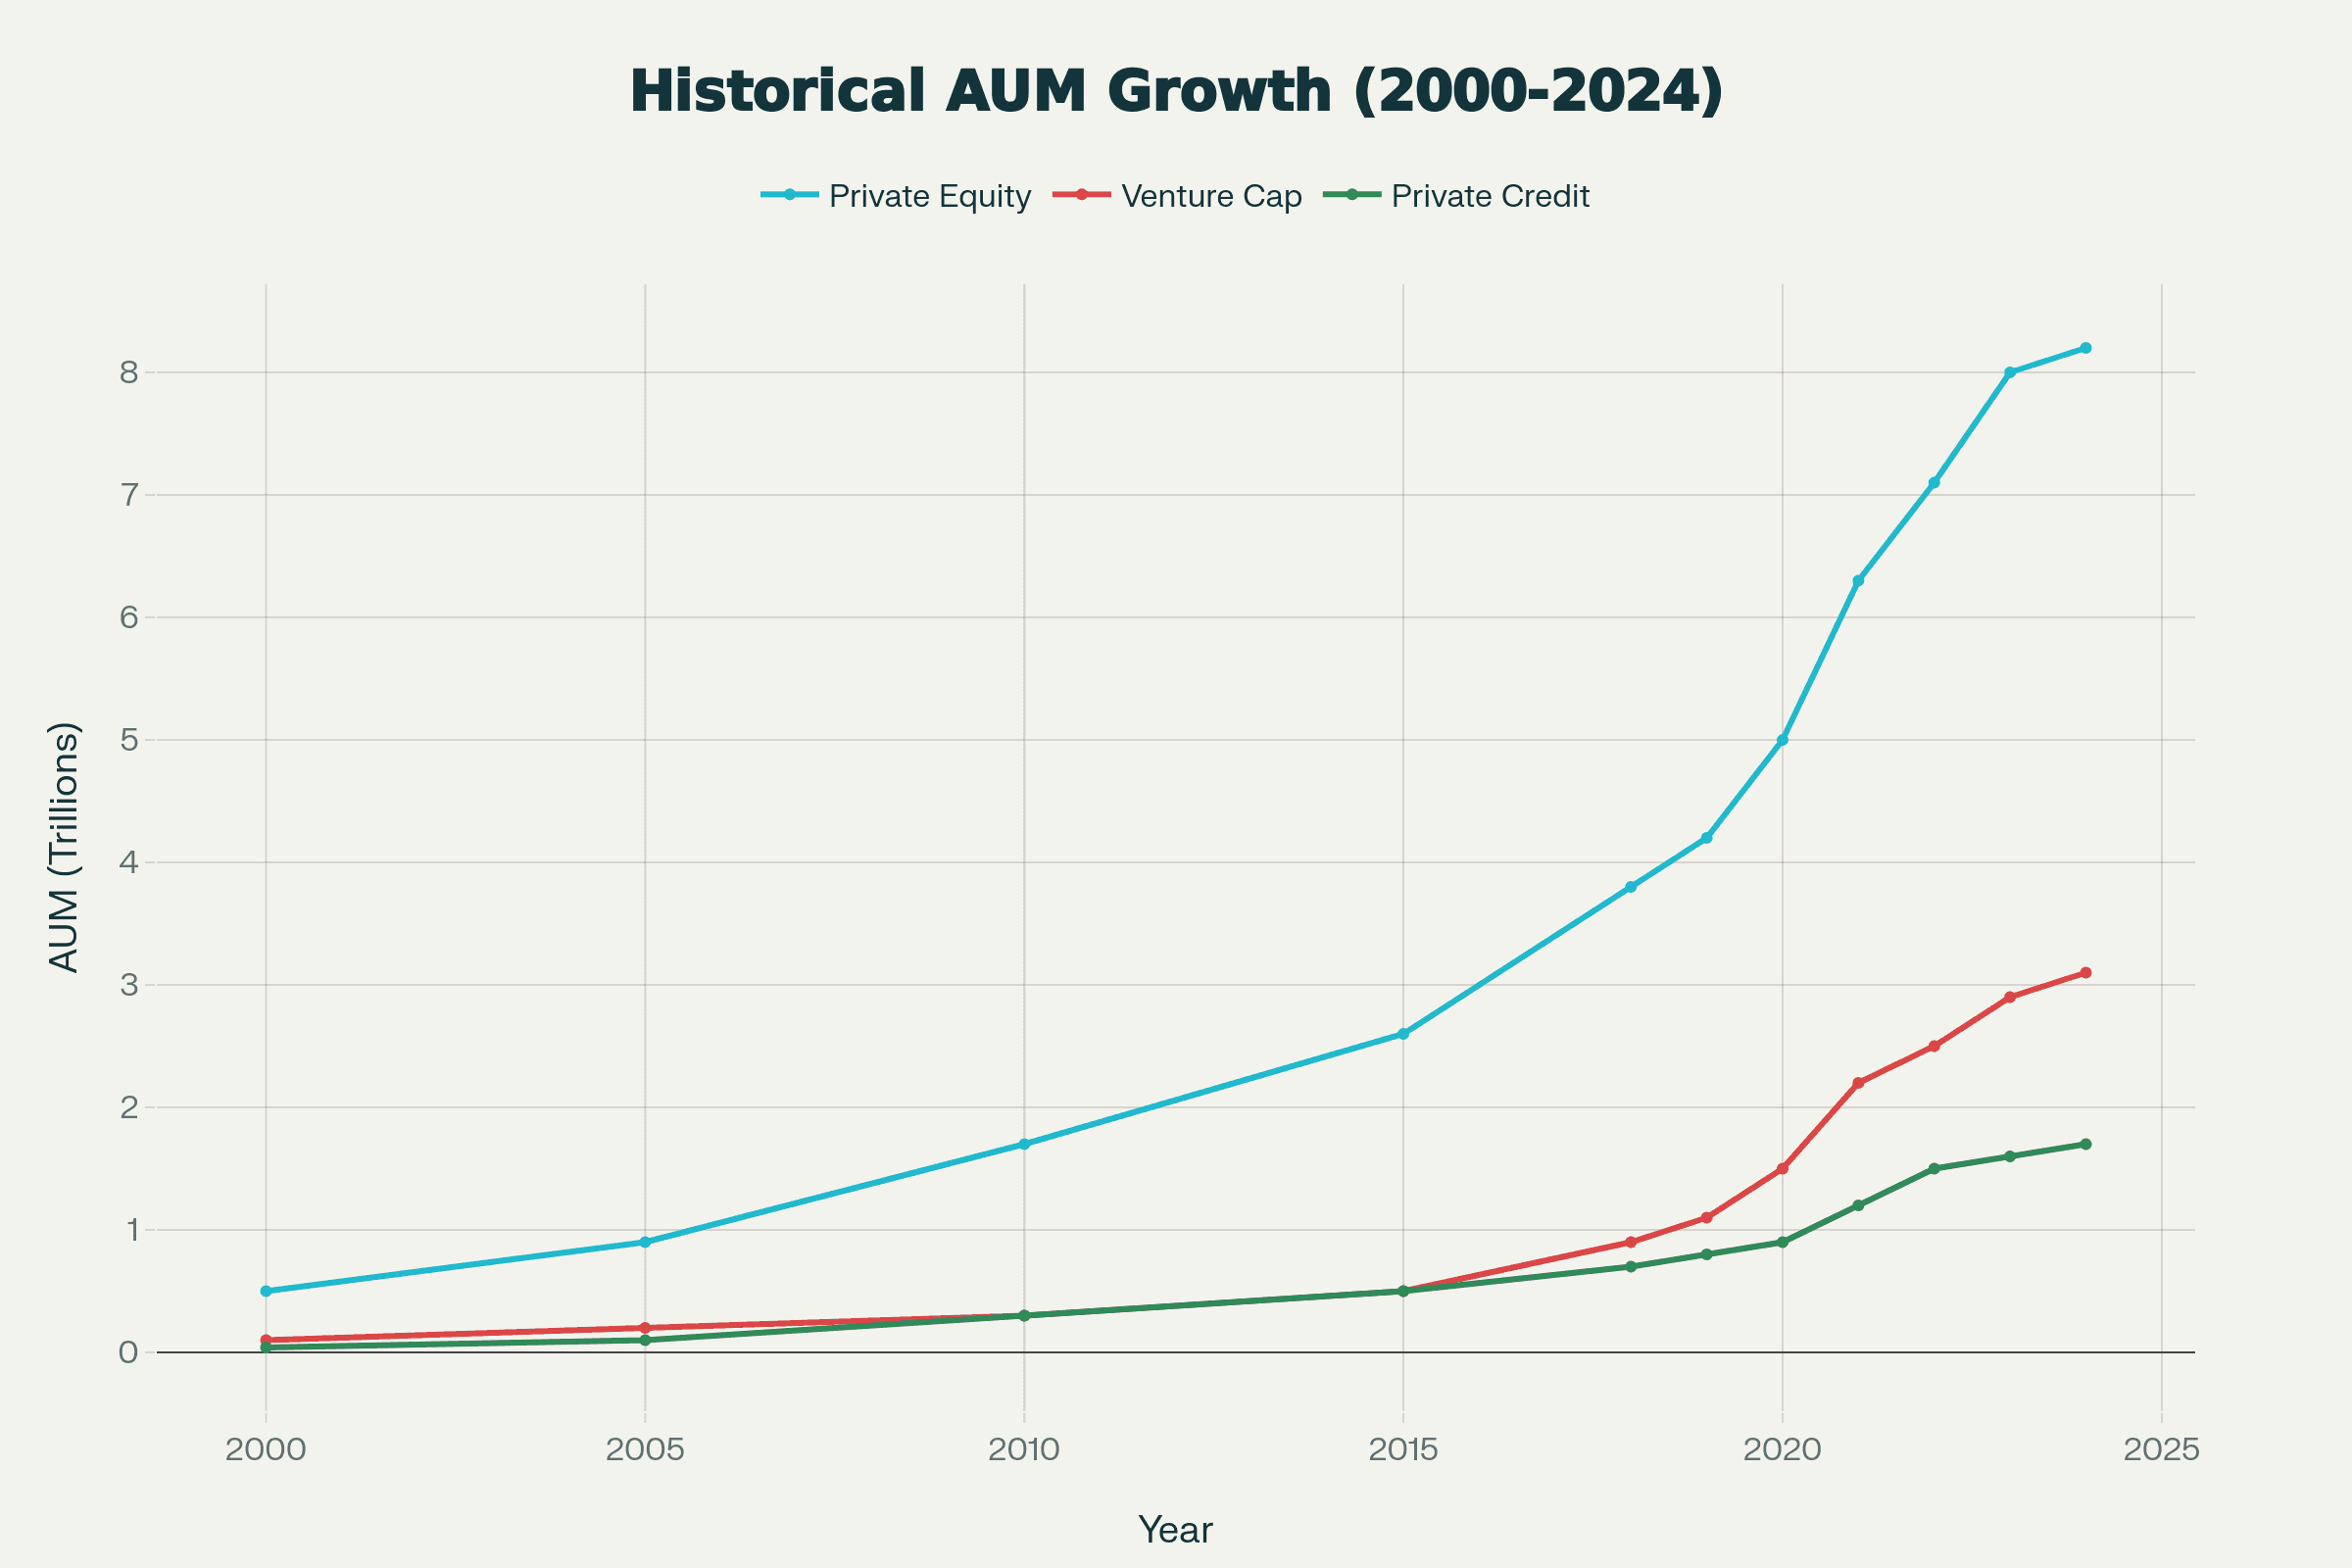 A multi-line chart showing the explosive growth of all three major strategies: Private Equity, Venture Capital and Private Credit
This wall of capital means companies no longer need public markets to fund growth. Late-stage rounds routinely exceed $500 million. Series D, E, and F rounds that would have been unthinkable twenty years ago are now standard. Single private investors can write checks large enough to fund multi-year roadmaps.
The infrastructure exists to keep companies private indefinitely. When Stripe raised $600 million at a $95 billion valuation in 2021, it demonstrated that private markets can provide growth capital at any scale.
The Cost of Being Public
Being a public company has become materially more expensive—not just in dollars, but in strategic flexibility.
 Chart shows the stark inverse relationship between declining company count (-50.4%) and expanding market capitalization (+471%), illustrating how value has become increasingly concentrated in fewer, larger companies.
Compliance costs for public companies now average $4 million to $7 million annually for mid-cap companies, with larger firms spending significantly more. Legal fees, auditing requirements, investor relations, and regulatory filings consume resources that could otherwise fund product development or market expansion.
Beyond direct costs, public companies face constant pressure to optimize for quarterly results rather than long-term value creation. Management teams spend substantial time on earnings calls, investor presentations, and managing stock price reactions to temporary setbacks. Strategic pivots become more difficult when every decision requires public explanation and faces immediate market judgment.
For technology companies in particular—where product cycles can take years and competitive positioning depends on strategic ambiguity—the transparency requirements of public markets create genuine competitive disadvantages.
Technology Changed the Capital Equation
Modern companies scale differently than their predecessors.
Manufacturing-heavy businesses of previous eras required massive capital expenditures before generating revenue. Building factories, distribution networks, and physical infrastructure demanded public market access. Software and technology-enabled companies operate under fundamentally different economics.
Cloud computing eliminated the need for companies to build their own server infrastructure. API-first architectures allow startups to integrate best-in-class services without building everything in-house. Automation and software leverage mean that businesses can scale revenue without proportionally scaling headcount or capital requirements.
A software company can grow from $10 million to $100 million in annual revenue with marginal increases in capital needs. The traditional growth curve that required public financing has flattened considerably.
Private Liquidity Infrastructure Matured
One historical driver of IPOs was providing liquidity to founders, employees, and early investors. That constraint has largely disappeared.
Secondary markets for private company shares have become sophisticated and substantial. Platforms facilitate transactions between existing shareholders and new investors without companies needing to go public. Structured liquidity programs allow employees to sell portions of their equity while companies remain private.
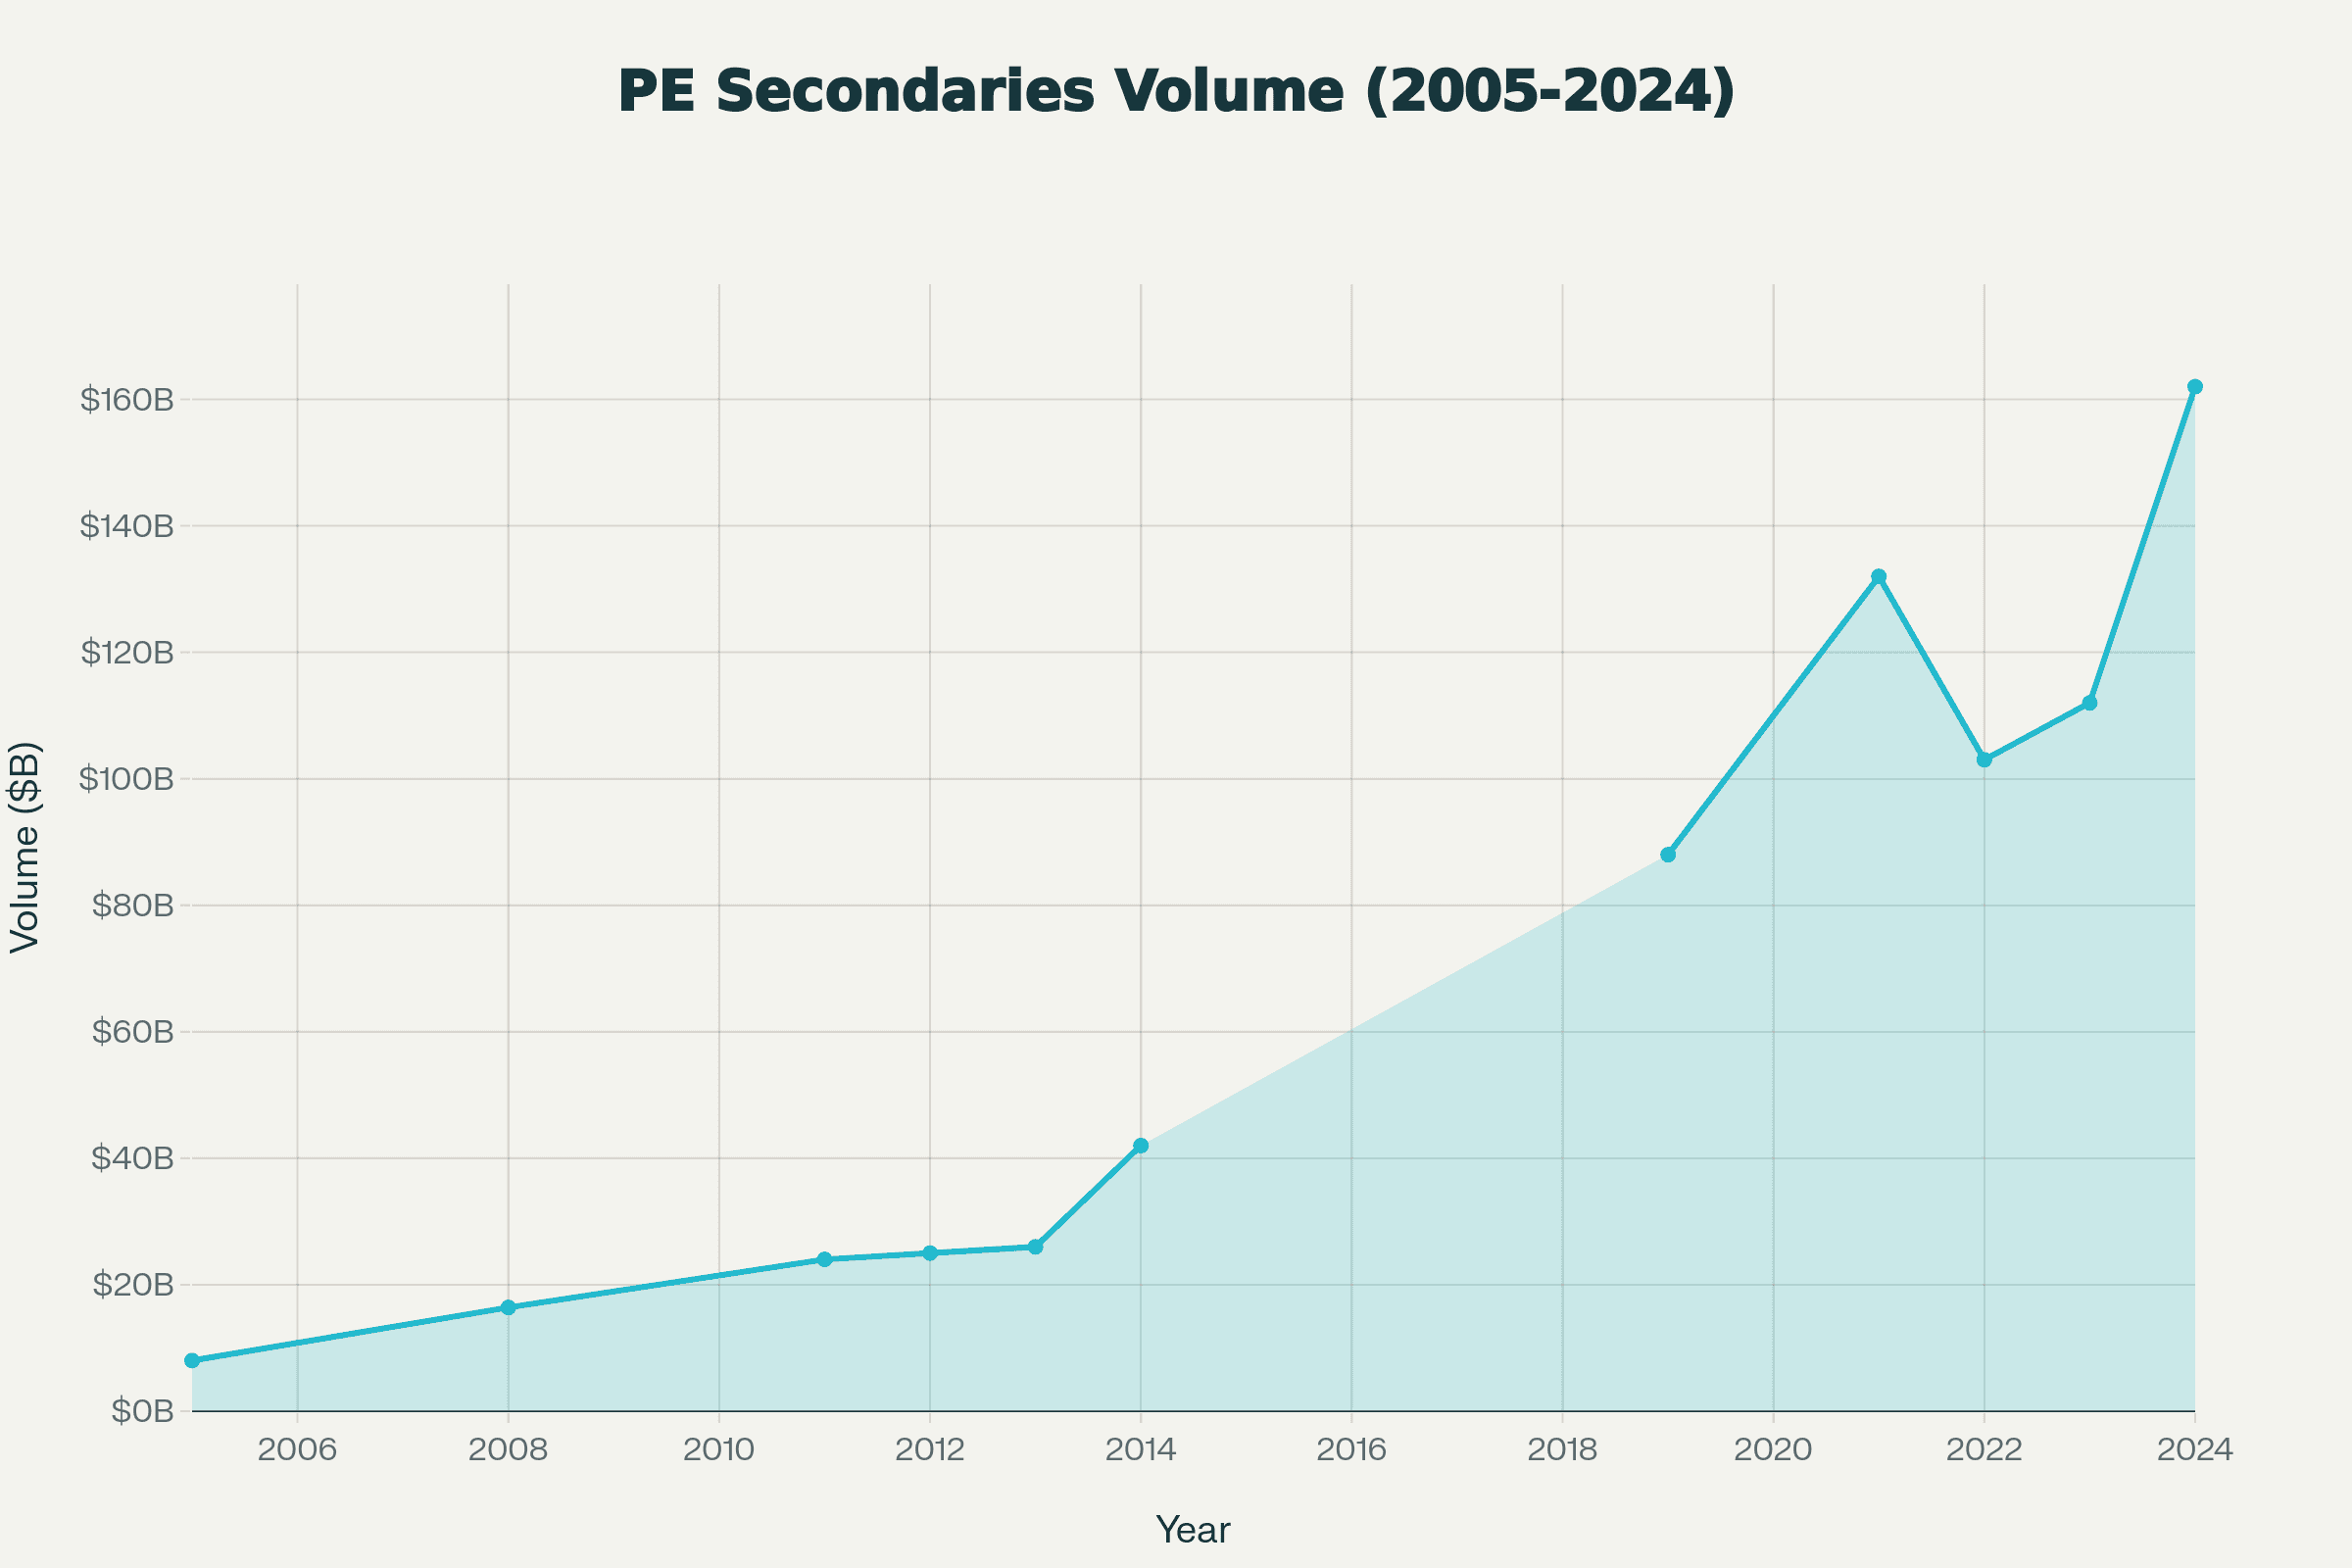 Global PE Secondaries Transaction Volume (2005-2024)
Private equity secondaries—where investors buy existing limited partner stakes in private funds—now exceed $150 billion in annual transaction volume. This creates liquidity for fund investors without requiring underlying portfolio companies to exit.
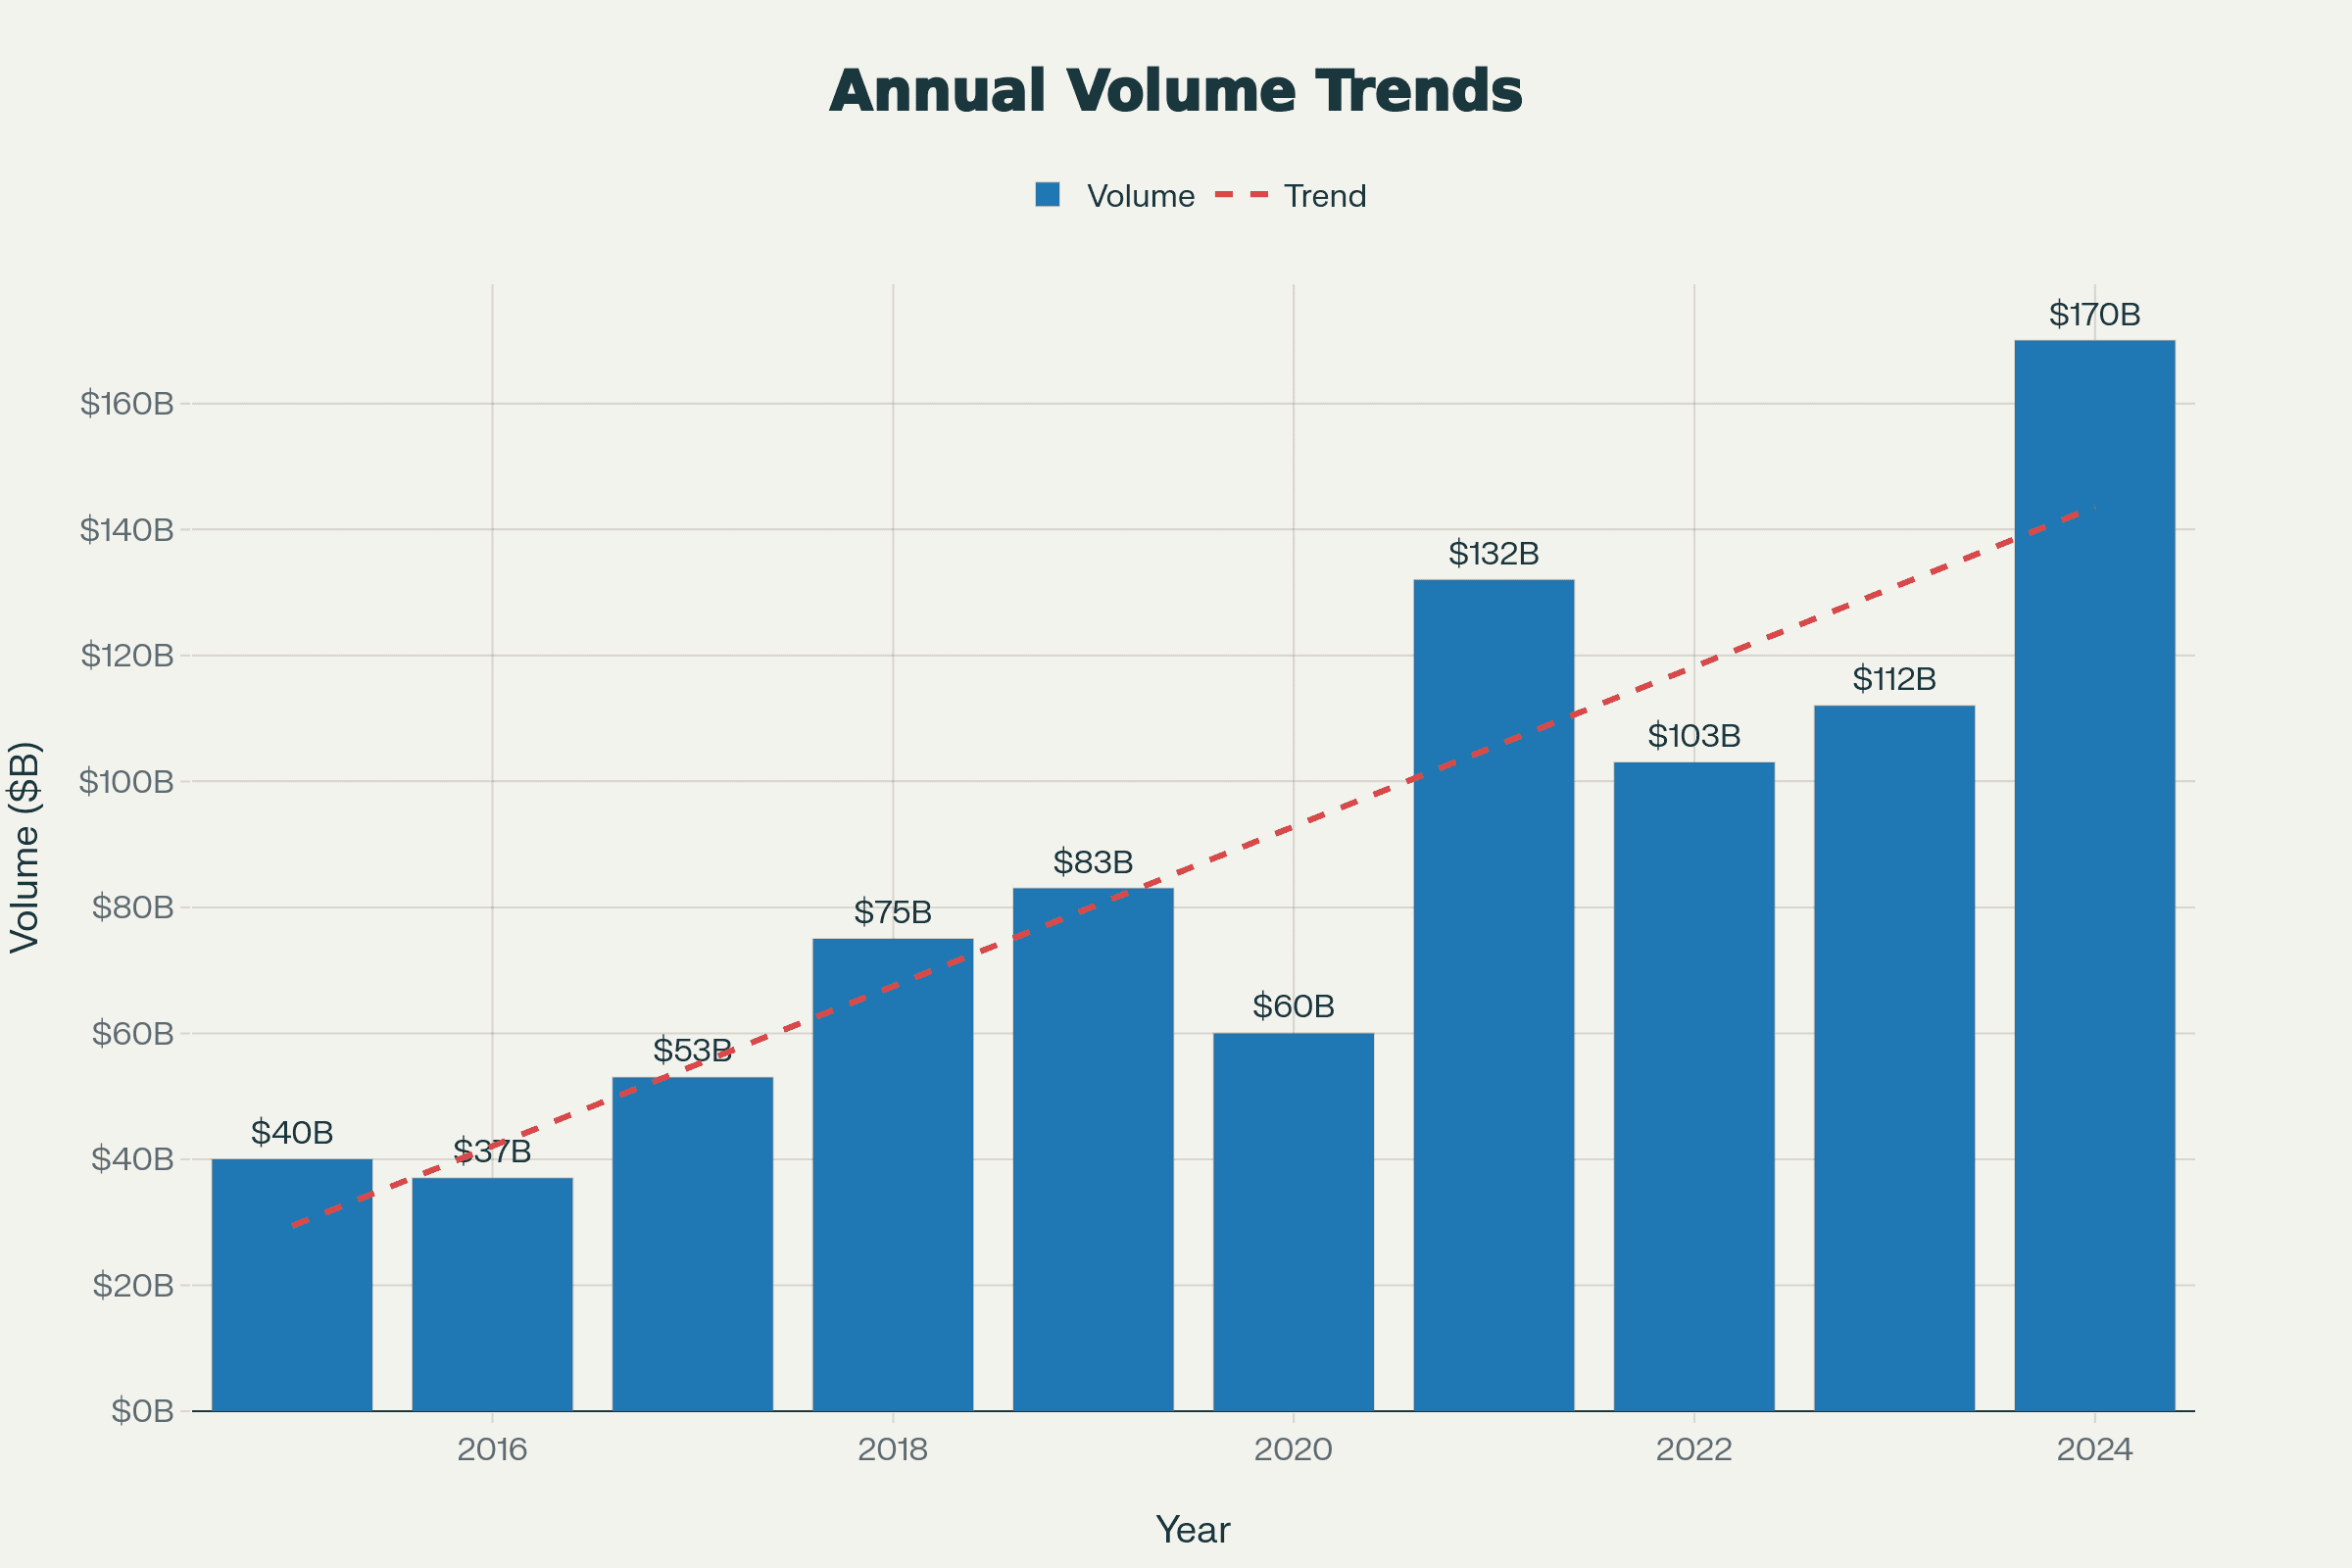 Global secondary market transaction volume grew from $40B in 2015 to a record ~$170B in 2024, driven by the rise of GP-led continuation funds and active LP portfolio management
The ecosystem has evolved to provide liquidity at every level of the private markets stack. Going public for liquidity purposes is increasingly optional.
Who Wins When Value Goes Private
This structural shift creates clear winners.
Large institutional investors with the resources, networks, and expertise to access private markets capture the most lucrative compounding years. A pension fund that can invest in Series C rounds participates in growth that used to belong to public market investors. The compounding differential is substantial—companies that might 3x from IPO to maturity often 30x from Series B to IPO.
Founders and management teams gain operational freedom. They can make long-term strategic bets without explaining quarterly fluctuations. They maintain control over information disclosure and competitive positioning. They avoid the distraction and scrutiny that comes with being public.
Late-stage private capital platforms—crossover funds, growth equity firms, and mega-fund venture capitalists—sit at the epicenter of value creation. They have scale to write large checks, expertise to add value, and networks to facilitate exits when the time comes.
Who Loses
The flip side is equally clear.
Public market investors—particularly retail investors—are systematically locked out of early-stage value creation. By the time a company goes public, the majority of its value appreciation has already occurred. The "privatization of alpha" means that public equity returns increasingly reflect mature companies with limited growth ahead.
When Snowflake went public in 2020 at a $70 billion valuation, it had already appreciated dramatically from its early private valuations. Public investors who bought at IPO captured subsequent growth, but missed the exponential phase that happened privately.
Public market indices themselves suffer. Fewer listings mean less dynamism and innovation in public portfolios. Index concentration increases—the S&P 500 is increasingly dominated by mega-cap technology companies that were founded decades ago. The pipeline of new public companies has slowed dramatically, reducing the refresh rate of public market exposure to emerging industries.
The Evidence: Where Value Actually Compounds
The data tells an unambiguous story.
SpaceX has grown from its Series A valuation of approximately $100 million in 2008 to a reported private valuation exceeding $150 billion by 2023—a 1,500x increase without ever accessing public markets. The company has demonstrated that private capital can fund even capital-intensive aerospace businesses indefinitely.
Stripe raised its first institutional funding in 2011. By 2021, it reached a $95 billion private valuation—all value created in private markets. The company has actively chosen to remain private despite having the profile and scale for a successful public offering.
Databricks crossed $1 billion in annual revenue and reached a $43 billion valuation entirely as a private company. The enterprise software business model—historically a public markets story—now plays out completely behind closed doors.
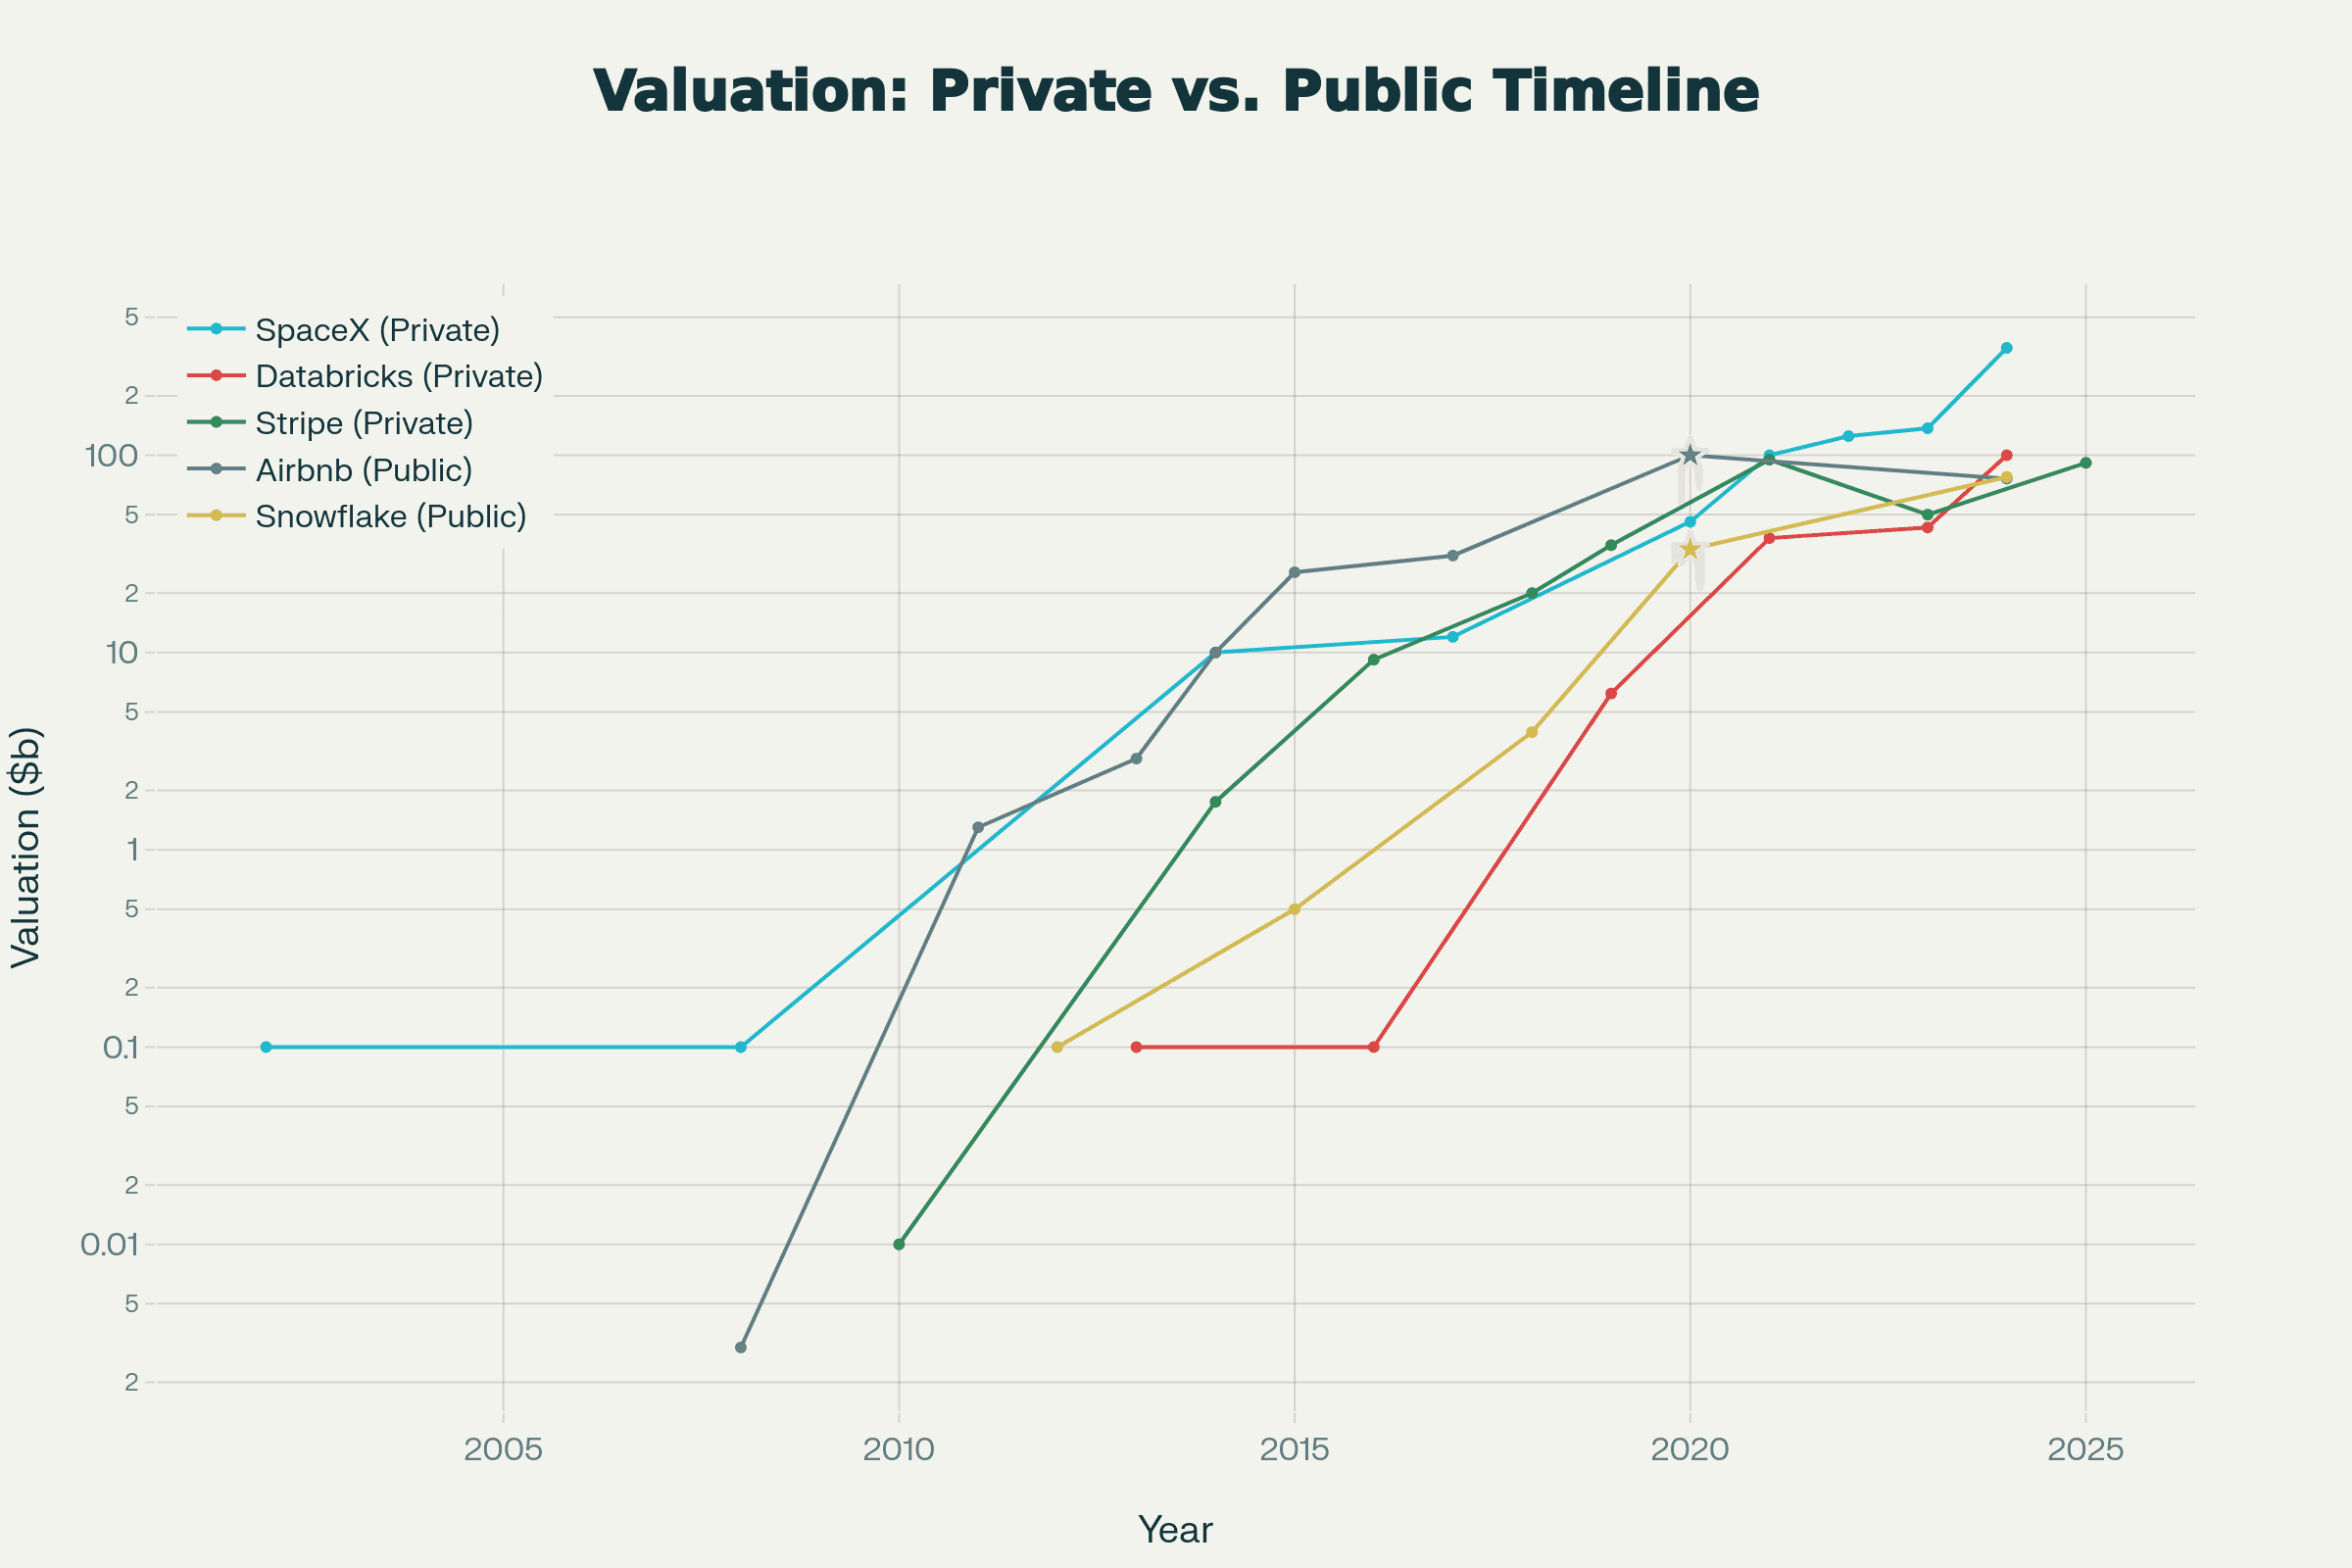 Valuation progression shows that private companies (SpaceX, Databricks, Stripe) have captured significantly more value pre-IPO than public company peers, with SpaceX reaching $350B—3.5x Snowflake's public market cap
These aren't outliers. They represent the new normal for category-defining companies.
Why This Shift Is Permanent
Several factors suggest this structural change is irreversible.
The demographics of capital have changed. Institutional investors managing multi-decade obligations need long-duration, return-seeking assets. Private markets fit that mandate perfectly. As these institutions build private markets programs and expertise, they become structurally dependent on the asset class for portfolio returns.
The regulatory environment shows no signs of reversing. If anything, public market regulations continue to increase in complexity and cost. The political appetite for reducing disclosure requirements or compliance burdens is essentially nonexistent.
Private liquidity infrastructure has reached maturity. The ecosystem that allows companies, employees, and investors to achieve liquidity without IPOs is now permanent and sophisticated. That infrastructure will only improve, further reducing the need for public listings.
Companies increasingly default to private-by-design structures. Founders entering the market today see staying private as the norm, not the exception. Cultural expectations have shifted—going public is now often viewed as a last resort rather than an aspiration.
What This Means for Allocators
For institutional investors and allocators, the implications are direct.
Traditional portfolio construction frameworks—built around public equity and fixed income—are structurally inadequate. A 60/40 portfolio captures almost none of the growth occurring in private markets. Under-allocation to private markets is no longer a conservative choice; it's a systematic risk.
Portfolio construction must evolve toward private-first thinking. This doesn't mean abandoning public markets, but it does mean recognizing that private markets exposure is essential for capturing growth, generating alpha, and accessing the companies defining the next decade.
Blending venture capital, growth equity, private credit, and secondaries creates diversified private markets exposure. Fund-of-funds structures provide access and diversification for allocators who lack the scale or expertise to build direct private markets programs.
The question isn't whether to allocate to private markets. It's how much, through what vehicles, and with what managers.
What This Means for Founders
For company builders, the calculus has changed.
Staying private longer allows founders to build toward strategic exits rather than being forced into premature public offerings. Control over timing, valuation expectations, and growth trajectory creates optionality that public companies lack.
The trade-off involves accepting less liquidity in exchange for operational freedom. But with secondary markets and structured liquidity programs, that trade-off has become increasingly manageable.
Strategic decisions around capital structure, investor selection, and exit planning now assume extended private periods. Building for long-term private ownership requires different governance structures, communication strategies, and stakeholder management than optimizing for quick public exits.
The Next Decade: What Comes Next
Several trends will define the next phase of this evolution.
Private markets will continue growing. Industry projections suggest private markets assets under management could exceed $25 trillion by 2030. The asset class is becoming increasingly core to institutional portfolio construction rather than remaining an alternative allocation.
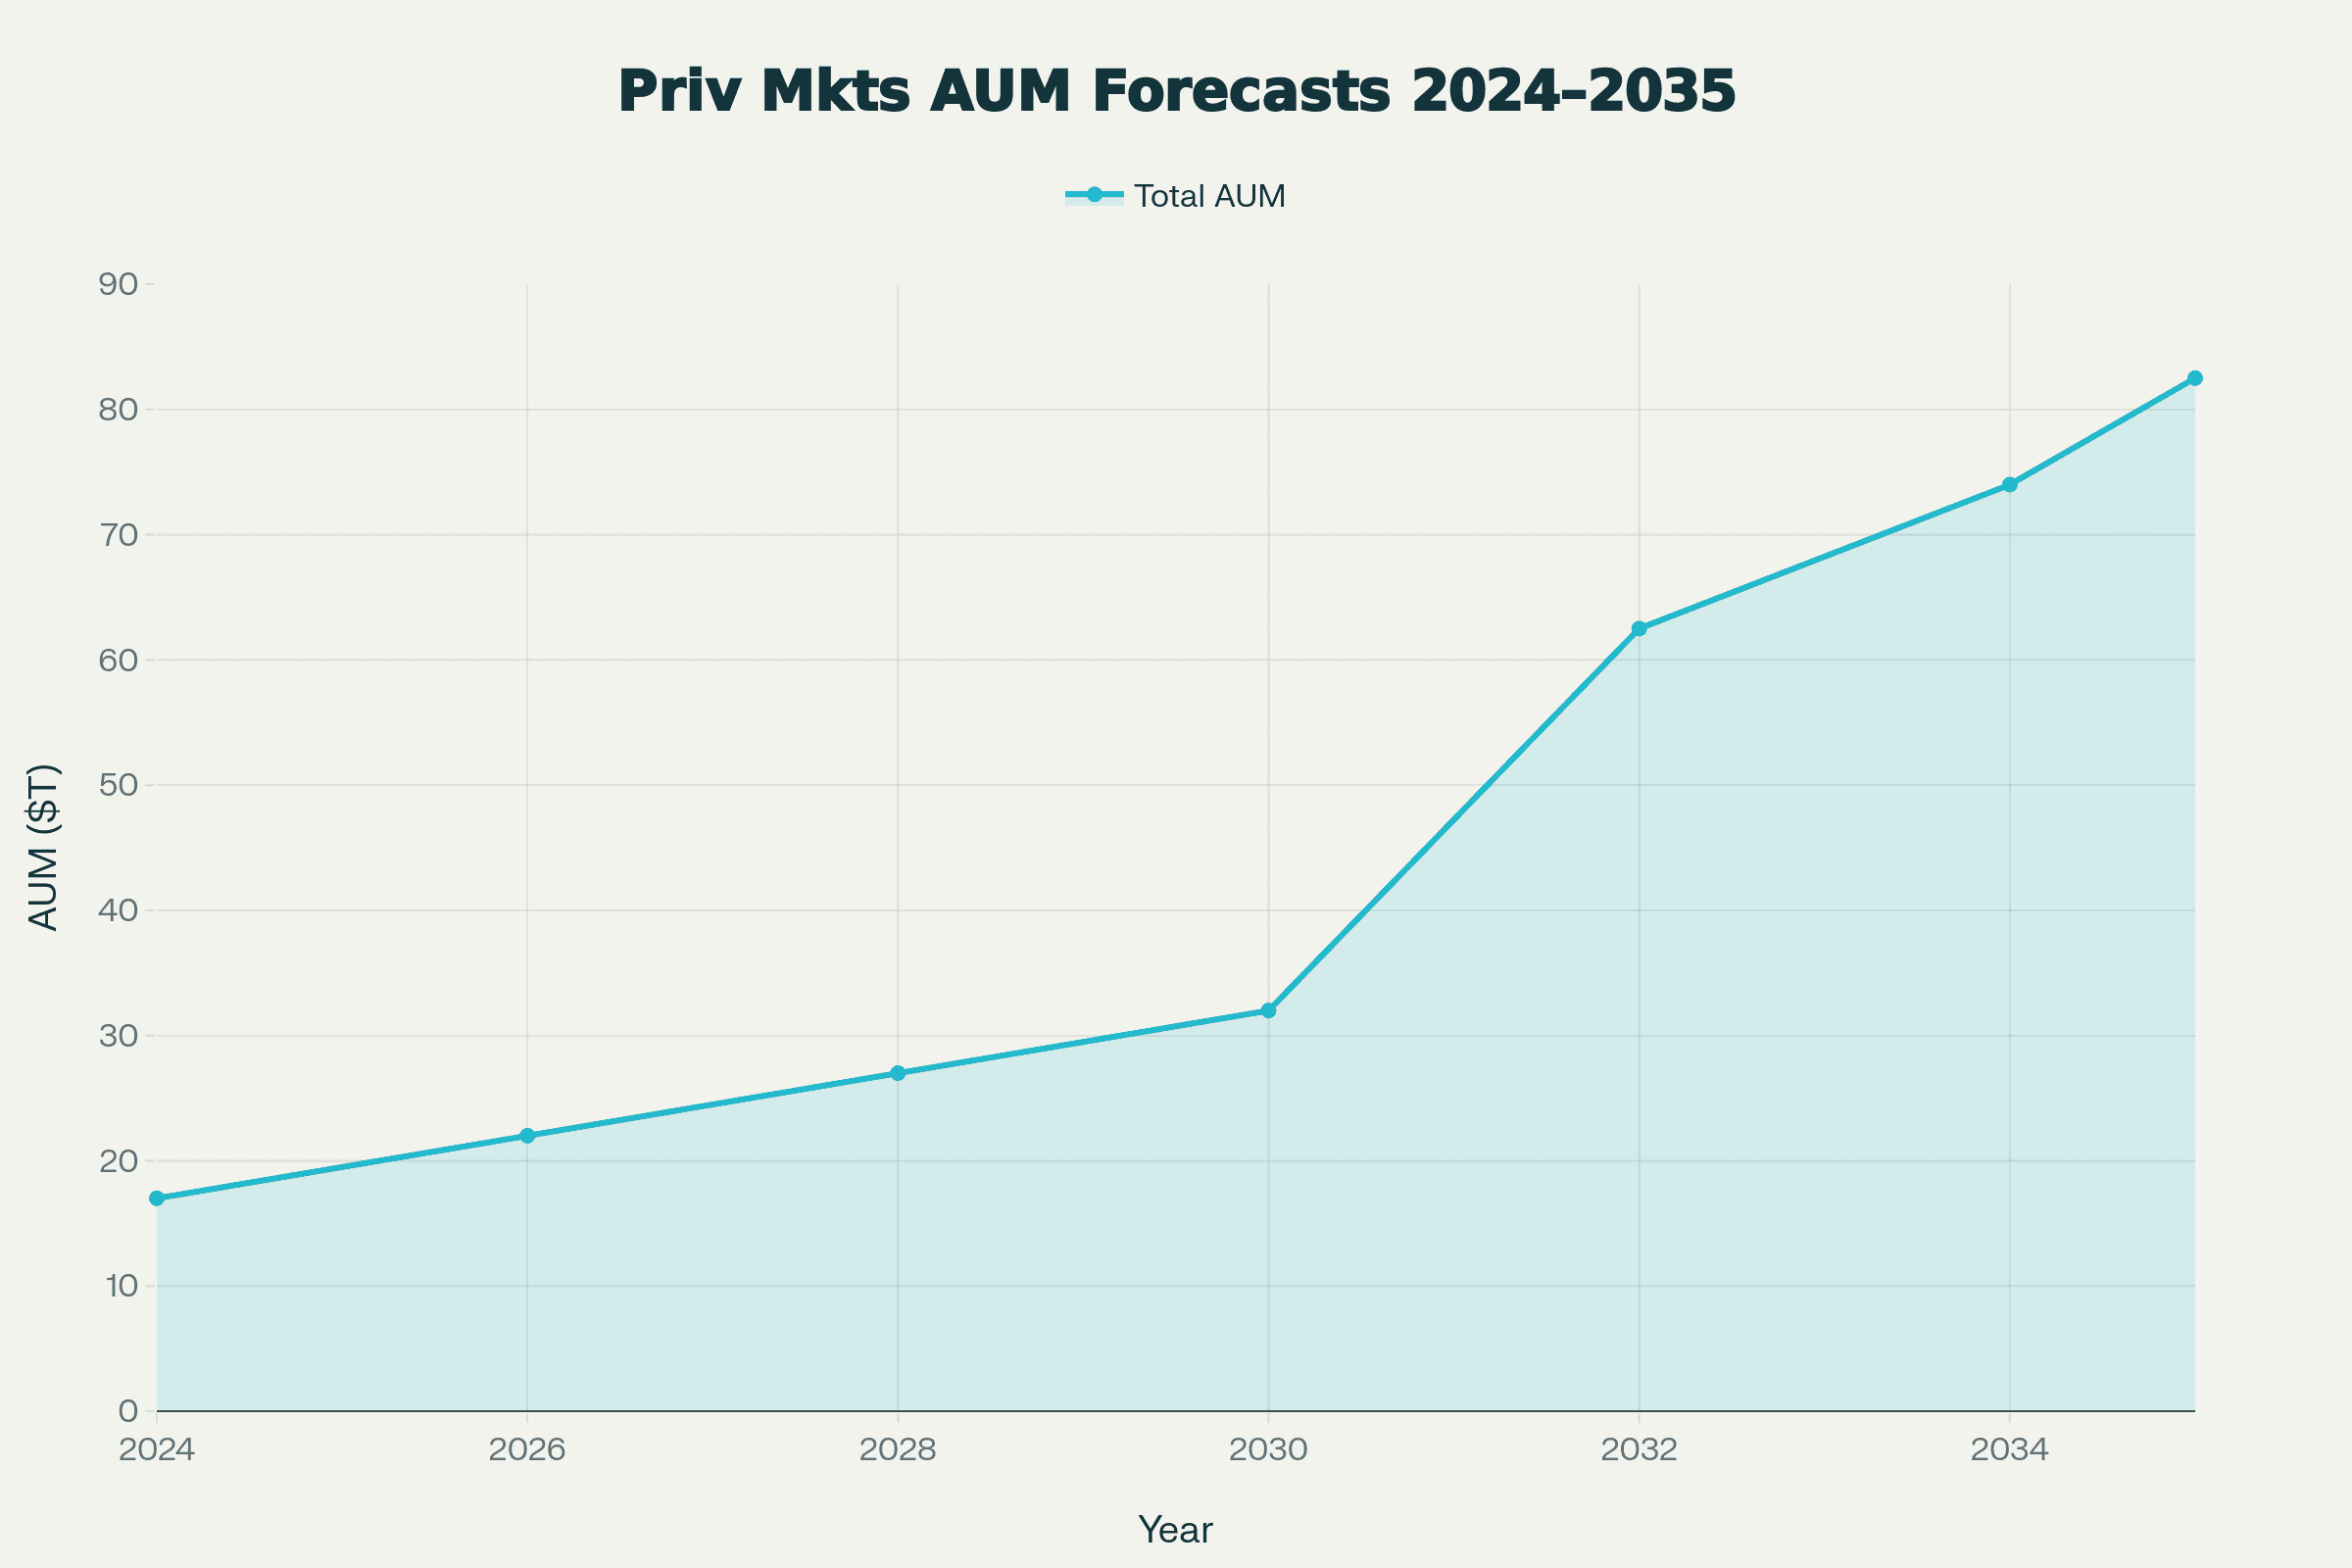 Chart shows the trajectory from $17T (2024) to $82.5T (2035), with acceleration expected 2030–2032. The 2030 asset class composition illustrates PE's continued dominance alongside significant Private Credit and VC contributions.
Secondary markets will likely surpass primary venture capital deployment. As more capital sits in private markets and more companies stay private longer, the market for existing positions will grow faster than the market for new primary investments.
Technology-enabled participation may widen access. Tokenization, fractional ownership platforms, and regulatory changes could eventually allow broader investor participation in private markets—though meaningful democratization remains years away.
Fewer IPOs will occur, and strategic acquisitions will dominate exits. Companies that do go public will do so later, larger, and often as mature businesses with limited growth ahead. M&A will increasingly serve as the primary exit mechanism for successful private companies.
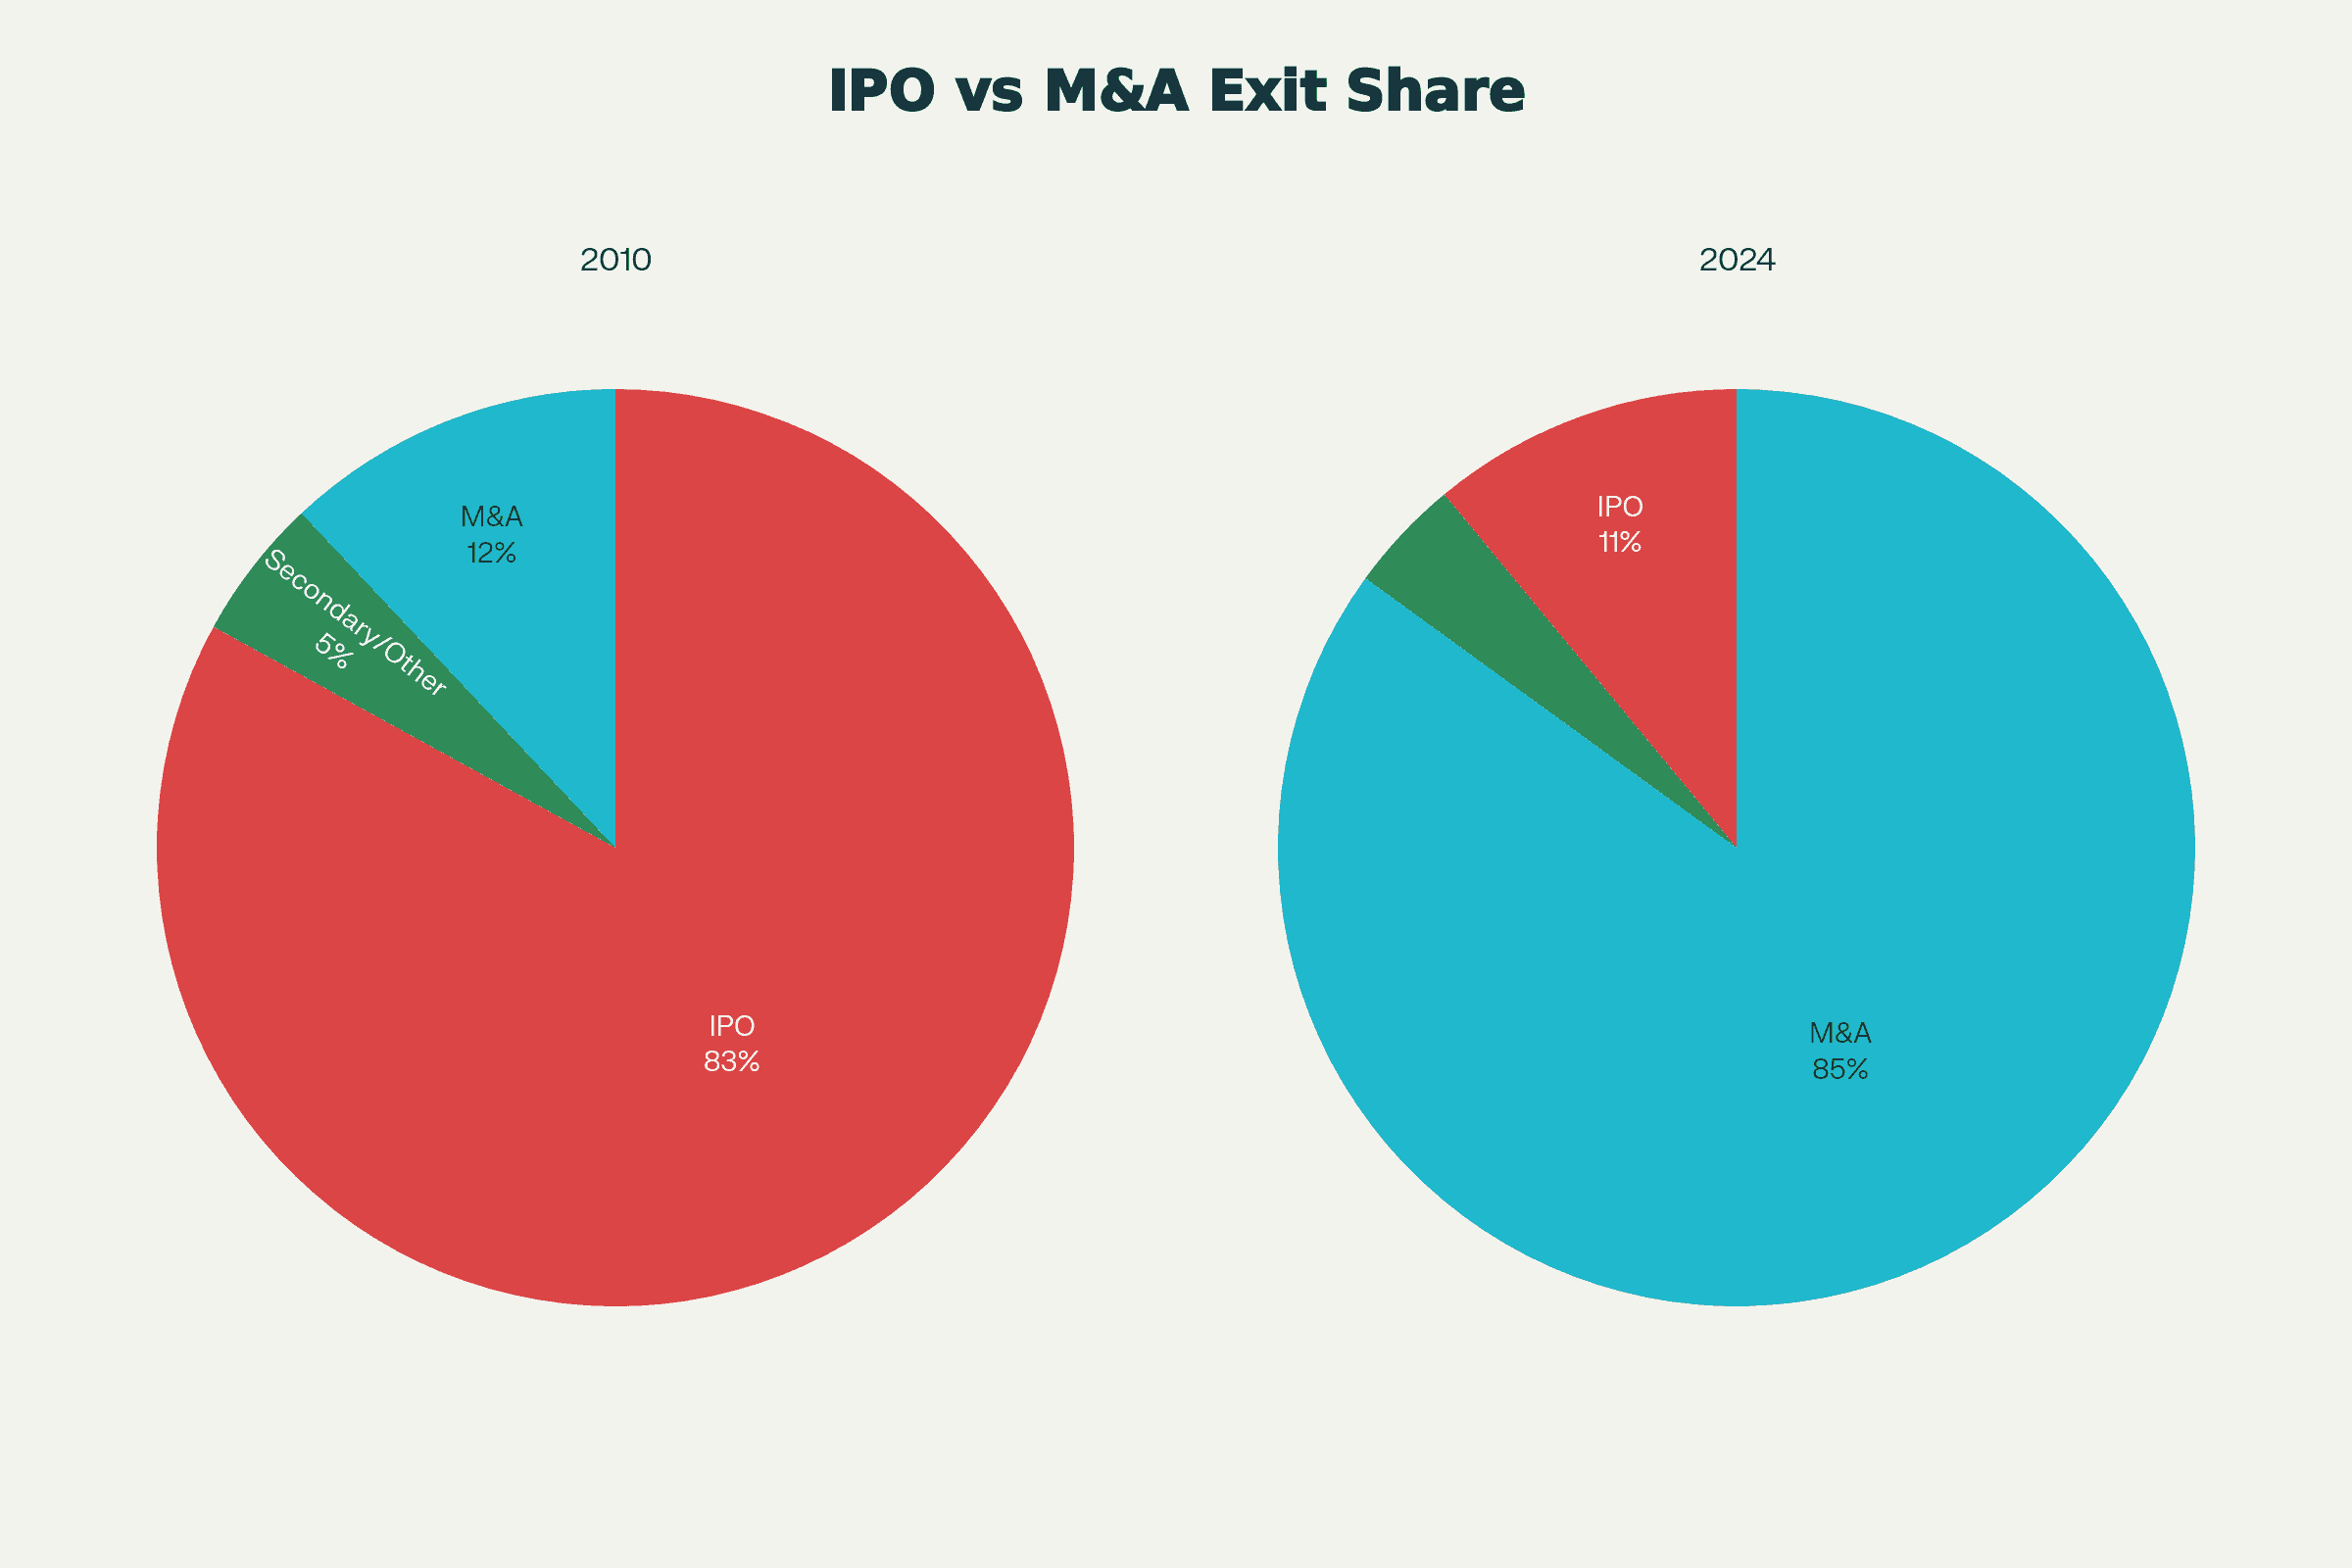 Exit Share Comparison: 2010 vs 2024 (Venture-Backed Companies)
The New Map of Value Creation
The migration of value from public to private markets represents one of the most significant structural changes in modern finance. What started as a response to crisis-era conditions has become the permanent architecture of how capital flows and how companies grow.
This shift creates profound implications for every market participant. Institutional allocators who fail to build meaningful private markets exposure will systematically underperform. Founders who understand how to leverage extended private periods will build more valuable, more defensible businesses. Public market investors will increasingly find themselves investing in mature companies with limited growth ahead.
Understanding private markets is no longer an edge. It's table stakes.
The question facing every institutional investor, every allocator, and every portfolio strategist is the same: how quickly can you reorient your capital allocation framework to match the new geography of value creation?
The companies defining the next decade are already growing, scaling, and compounding. They're just doing it where most investors can't see them.


