

DPI, or Distributions to Paid-In Capital, is a core metric for measuring how much cash a private equity fund has returned to its investors. Unlike TVPI or IRR, which include unrealized gains, DPI focuses solely on actual distributions relative to committed capital. This article explains how DPI is calculated, what it reveals about fund performance, and how it fits into a broader LP reporting toolkit.
Key Takeaways
- DPI measures realized returns by dividing cumulative distributions by paid-in capital, focusing exclusively on actual cash returned to investors
- A DPI above 1.0x indicates investors have received back more than their initial investment, with 1.5-2.0x considered strong performance
- Unlike TVPI, DPI excludes unrealized gains and paper valuations, making it the most transparent and manipulation-resistant performance metric
- Recent vintage funds (2021-2022) show significantly delayed DPI generation, with only 9% generating distributions after three years versus 25% for 2017 vintages
- Synthetic distributions through NAV facilities represent a growing manipulation risk, requiring enhanced due diligence from limited partners
What is Distributions to Paid-In Capital (DPI)?
Distributions to Paid-In Capital serves as the most fundamental performance metric in private equity, representing the cumulative value of all cash distributions paid to limited partners (LPs) divided by the total paid-in capital contributed by those investors. This metric provides a concrete measure of how much capital has been distributed back to investors compared to their actual contributions, earning its alternative name as the realization multiple.
The significance of DPI lies in its exclusive focus on realized returns – actual cash that has been returned to investors through successful exits, dividends, or other liquidity events. Unlike metrics incorporating theoretical valuations or unrealized gains, DPI represents tangible value that investors can "buy bread with," as one industry expert memorably noted. This cash-based nature makes DPI particularly valuable for institutional investors managing liquidity needs and reinvestment strategies.
DPI plays multiple critical roles in the private equity ecosystem. For limited partners, it provides reassurance about a fund's ability to generate tangible returns and offers confidence when making reinvestment decisions. For general partners, strong DPI performance demonstrates execution capability and supports fundraising efforts. The metric also serves as an essential benchmarking tool, enabling comparison across funds, strategies, and vintage years based on actual cash generation rather than paper valuations.
Understanding DPI Calculation and Interpretation
The DPI calculation follows a straightforward formula that belies its analytical power:
DPI = Cumulative Distributions ÷ Paid-In Capital
Where:
- Cumulative Distributions include all capital returned to LPs through realized profits from exits (IPOs, M&A, secondary sales), cash distributions from portfolio operations, and stock distributions when portfolio companies go public
- Paid-In Capital represents only the capital that has been "called" by the fund, not the total committed amount
This distinction between paid-in and committed capital proves crucial. General partners make capital calls progressively as investment opportunities arise, meaning paid-in capital typically equals less than total commitments until later fund stages.
Net vs. Gross DPI Calculations
The industry distinguishes between two calculation methods:
Net DPI (Industry Standard):
- Formula: (Total Distributions - Management Fees - Carried Interest) ÷ Paid-In Capital
- Reflects actual returns to LPs after all expenses
- Required by SEC Marketing Rule when reporting performance
Gross DPI:
- Formula: Total Distributions ÷ Paid-In Capital
- Shows raw fund performance before fee impact
- Useful for evaluating pure investment skill
Interpreting DPI Values
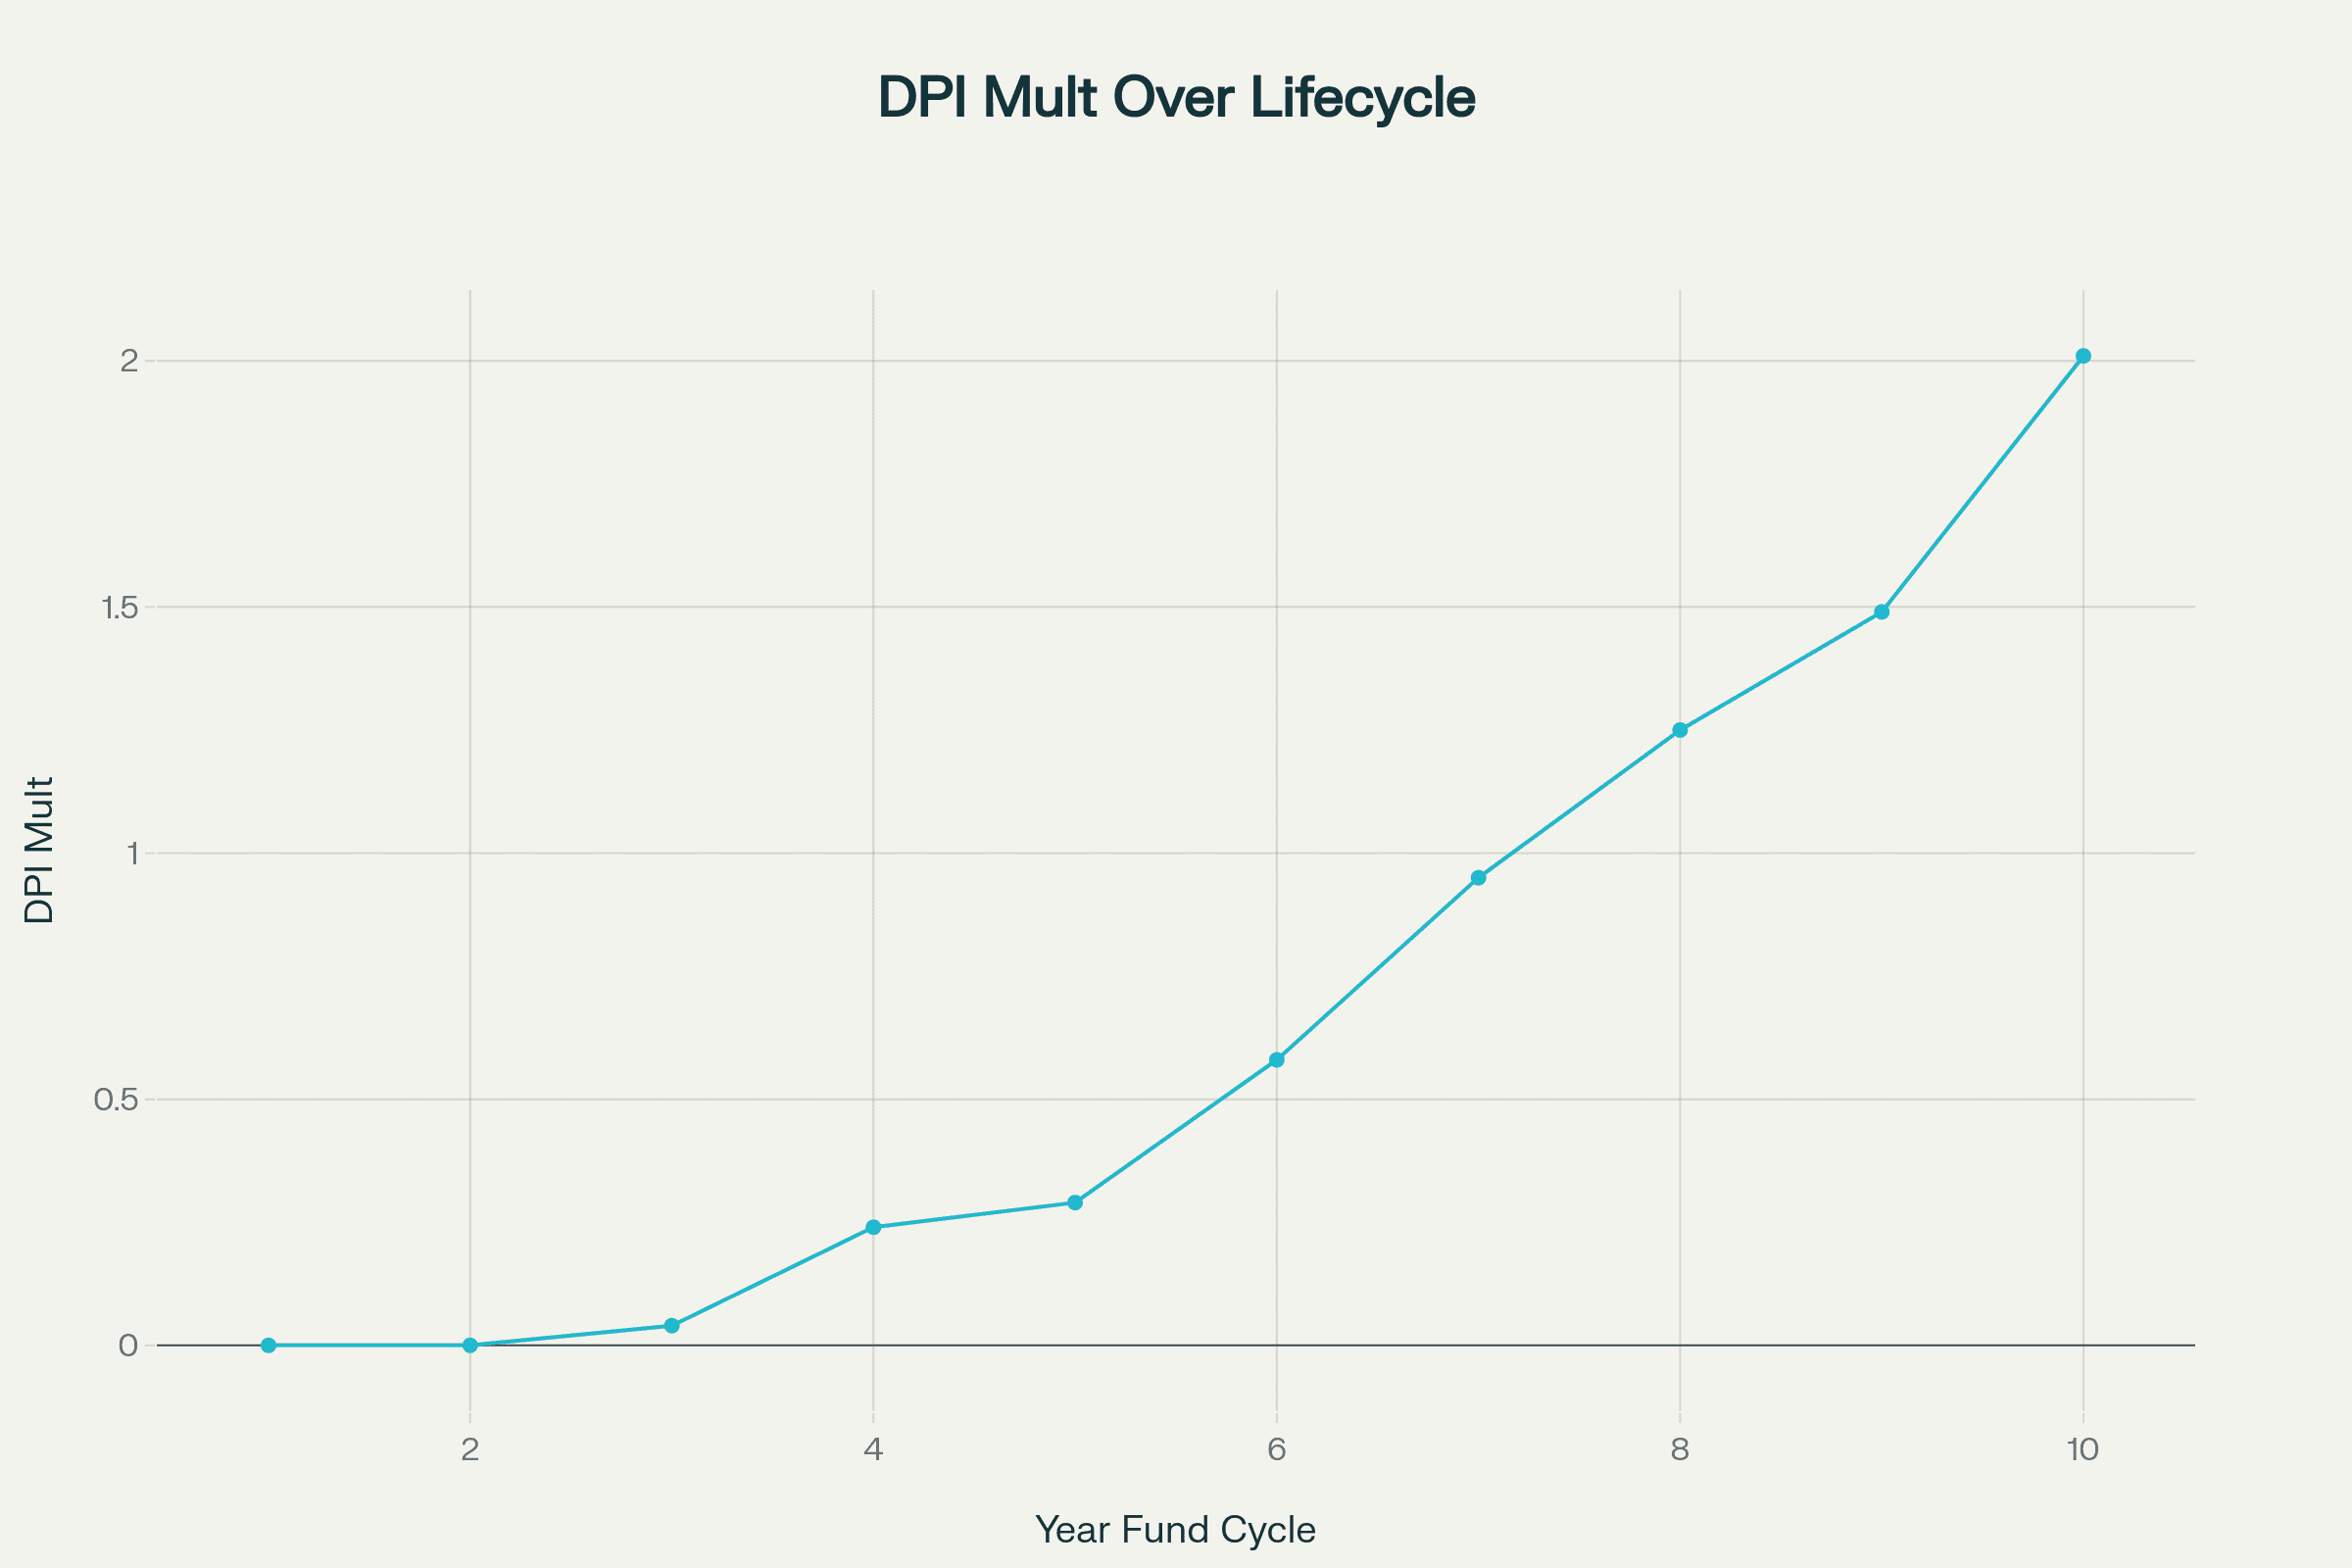
DPI interpretation requires understanding both absolute values and lifecycle context:
- DPI < 0.5x: Typical for funds in years 1-4 during active investment period
- DPI = 1.0x: Breakeven point where investors recover initial capital
- DPI 1.5-2.0x: Strong performance indicating value creation success
- DPI > 2.0x: Excellent results typically achieved by top-quartile funds
Current Market Dynamics
Recent Carta analysis of over 1,800 venture funds reveals concerning trends in DPI generation timing. Among 2017 vintage funds, 25% had begun generating DPI after three years and 59% after five years. In stark contrast, only 9% of 2021 vintage funds showed any DPI after three years, highlighting the extended liquidity timelines facing current investors. This trend has made DPI even more critical, with one GP noting: "I tell my LPs all the time: We are fully focused on DPI. Because until you realize that liquidity, we have failed."
Common Questions About Distributions to Paid-In Capital
How does DPI differ from other private equity performance metrics?
DPI stands apart from other metrics through its exclusive focus on realized cash returns. While Total Value to Paid-In Capital (TVPI) includes both realized distributions (DPI) and unrealized residual value (RVPI), DPI measures only actual cash returned. The relationship is expressed as TVPI = DPI + RVPI. Unlike Internal Rate of Return (IRR), which accounts for timing through complex discounted cash flow calculations, DPI provides a simple multiple without time-weighting. This simplicity makes DPI less susceptible to manipulation through timing games or subjective valuations.
What constitutes good DPI performance across different fund strategies?
Performance benchmarks vary significantly by strategy and vintage. Venture capital funds typically show lower early DPI due to longer development cycles, with life sciences investments requiring extended timelines for regulatory approvals. Buyout funds generally achieve more predictable DPI progression through shorter hold periods averaging 3-5 years. Growth equity strategies fall between these extremes. Historical Cambridge Associates data shows top-quartile venture funds achieving DPI multiples ranging from 2.42x for certain vintages to more modest returns in challenging markets.
Can fund managers manipulate DPI calculations?
While DPI resists manipulation better than valuation-based metrics, several techniques can artificially inflate figures. The most prominent involves "synthetic distributions" through NAV-based financing facilities, where managers borrow against portfolio values to create distributions without actual sales. Fund managers may also engage in timing manipulation, accelerating profitable exits while delaying loss recognition, or using "sell winners, hold losers" strategies that front-load positive returns. The ILPA has responded with guidelines requiring explicit consent for NAV facilities and enhanced disclosure of calculation methodologies.
Why do funds often show high TVPI but low DPI?
This divergence reflects significant unrealized value that hasn't converted to cash distributions. High TVPI with low DPI indicates substantial paper gains (high RVPI) awaiting monetization. Common causes include valuation inflation during bull markets without corresponding exit opportunities, early-stage investment strategies requiring extended development periods, and manager preferences for maintaining ownership in high-performing companies. Historical analysis demonstrates that peak TVPI often exceeds final realized DPI, validating the adage that "the lemons ripen in 2½ years while the pearls take seven or eight."
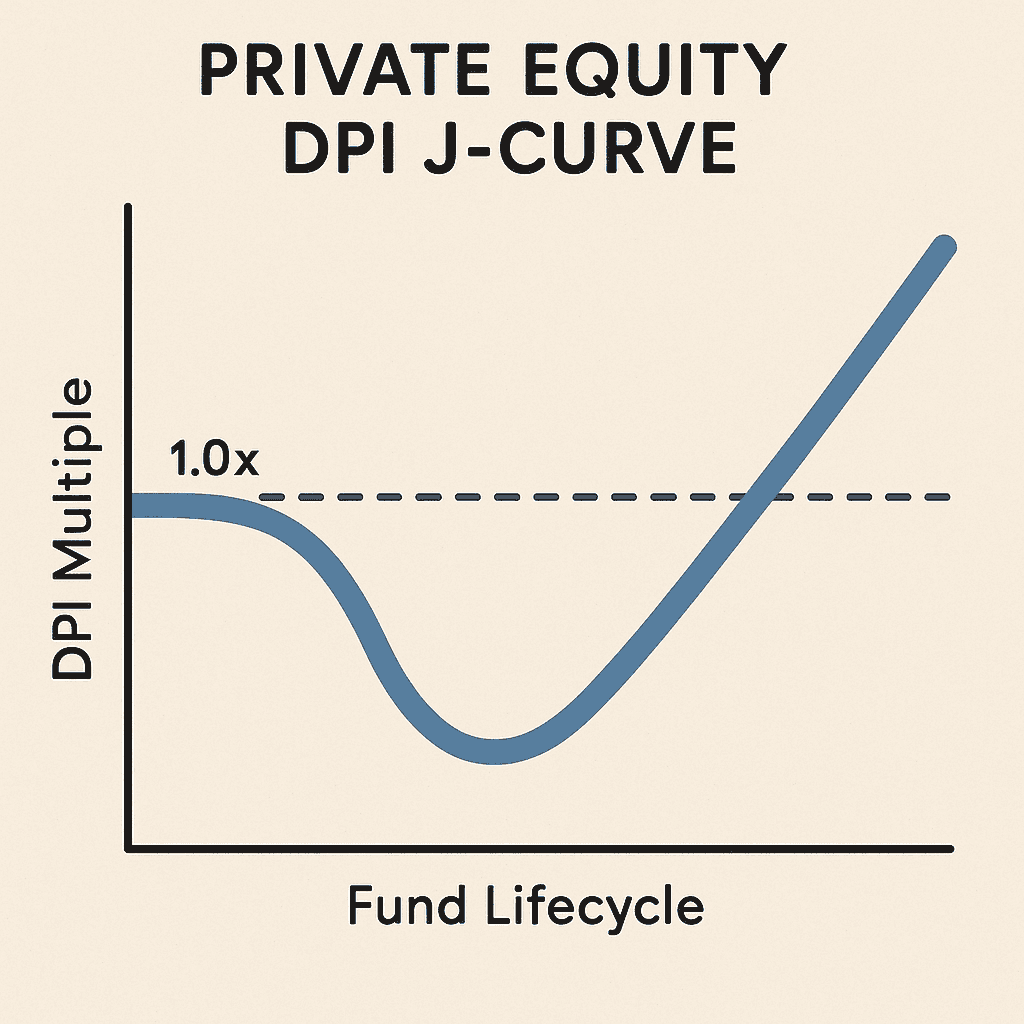
How has the J-curve effect evolved in recent market conditions?
The traditional J-curve pattern, where funds show negative returns initially before accelerating gains, has extended significantly. While historically funds might begin showing meaningful DPI by year 4-5, current market conditions have pushed this timeline to years 6-8 or beyond. Factors include elevated private market valuations limiting exit opportunities, reduced IPO activity, and strategic buyers becoming more selective. This evolution has made early DPI generation even more valuable as a differentiator among fund managers.
Conclusion
Distributions to Paid-In Capital has rightfully earned its position as the premier metric for evaluating private equity fund performance, providing the most tangible measure of investment success through actual cash returns. In an environment where high valuations create impressive paper returns but limited exit opportunities constrain liquidity, DPI's focus on realized distributions becomes increasingly critical. For limited partners navigating complex investment decisions, DPI offers clarity amidst uncertainty – a concrete measure of value creation that transcends market cycles and valuation bubbles. As the private equity industry continues evolving, DPI will remain the definitive arbiter of fund manager effectiveness, embodying the fundamental promise of alternative investments: the ability to generate superior returns and actually deliver them to investors.


