

Public Market Equivalent (PME) is a method for comparing private equity performance to public market benchmarks like the S&P 500. By aligning cash flows and measuring relative value creation, PME helps investors assess whether their private investments outperform or underperform public alternatives. This guide breaks down PME methods, calculation techniques, and when each variation is best applied.
Key Takeaways
- PME constructs a synthetic public portfolio by "buying" the index with capital calls and "selling" with distributions at exact cash flow dates
- Direct Alpha provides the most theoretically rigorous measurement of excess returns, while other methods offer intuitive approximations
- The Kaplan-Schoar PME ratio indicates outperformance when above 1.0 and avoids technical issues of IRR-based methods
- Index selection critically impacts results—misaligned benchmarks can distort performance evaluation by 20-30%
- Approximately 5-6% of funds experience the "shortness issue" where negative synthetic NAVs invalidate traditional PME calculations
Understanding Public Market Equivalent
Public Market Equivalent emerged from the fundamental challenge of comparing illiquid private equity investments with liquid public markets. Traditional metrics like IRR fail to account for the opportunity cost of capital, while simple return comparisons ignore the staggered nature of private equity cash flows. PME addresses these limitations by creating a hypothetical investment scenario where each private fund cash flow is simultaneously invested in or withdrawn from a chosen public index.
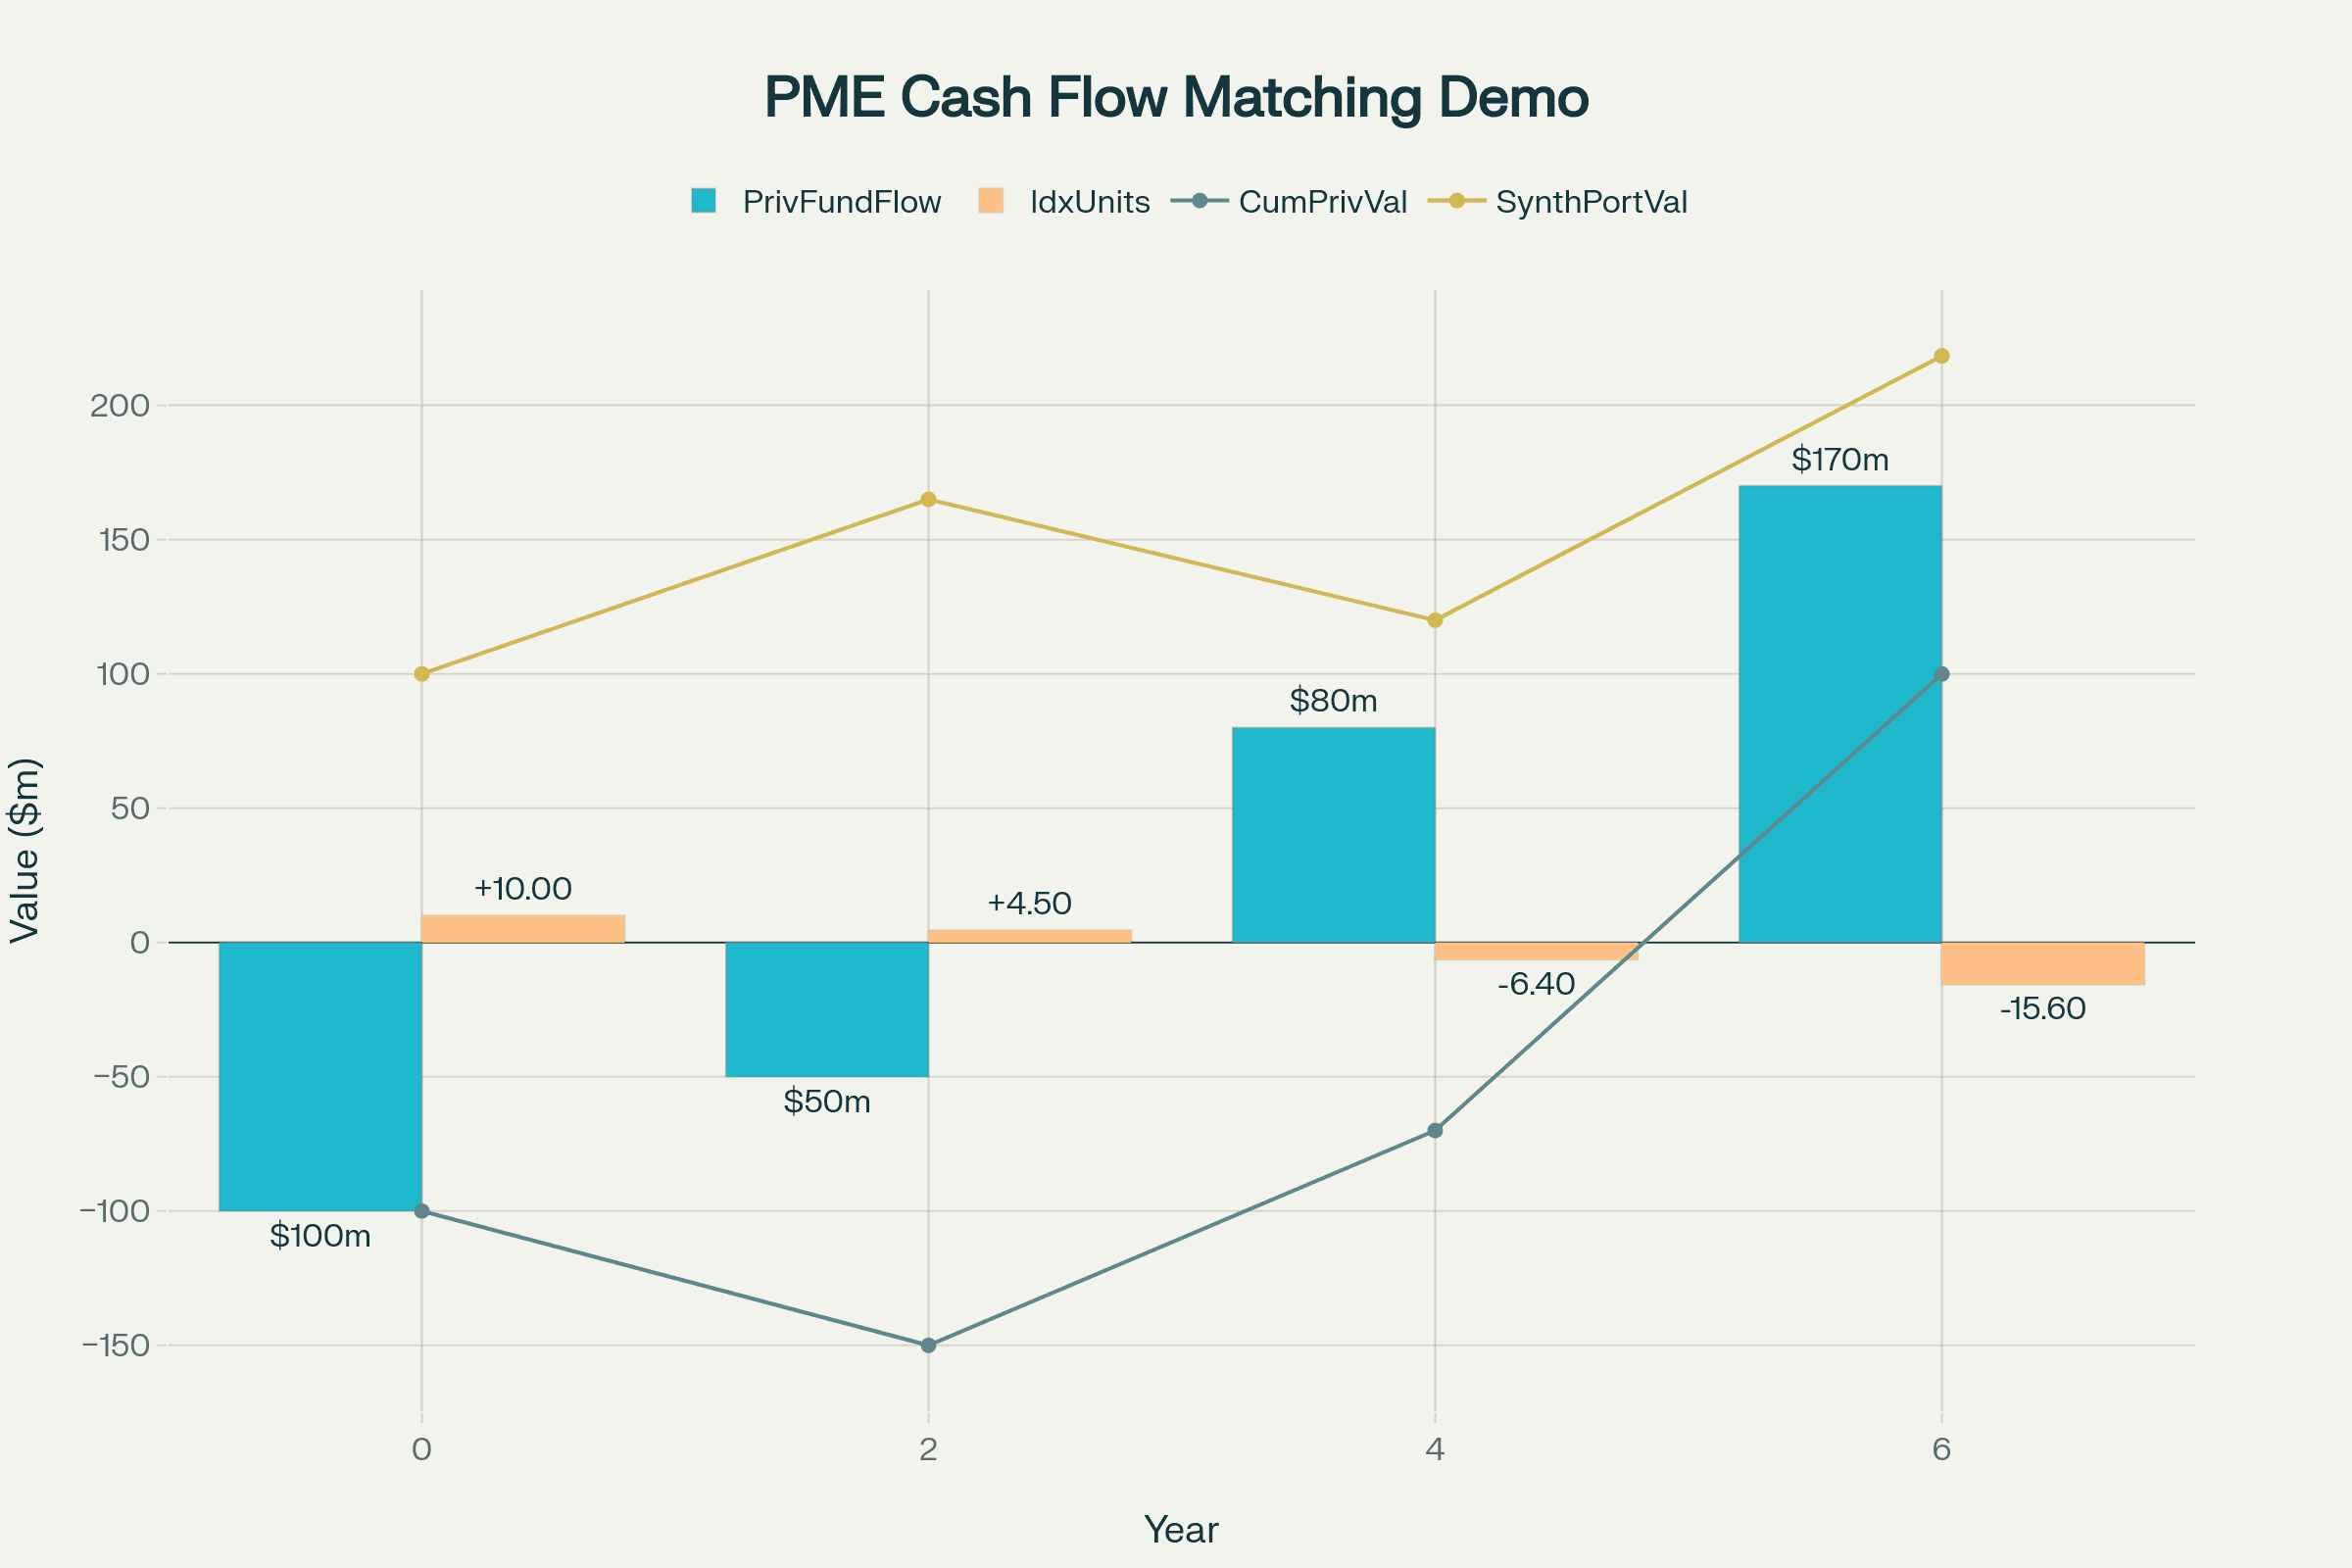
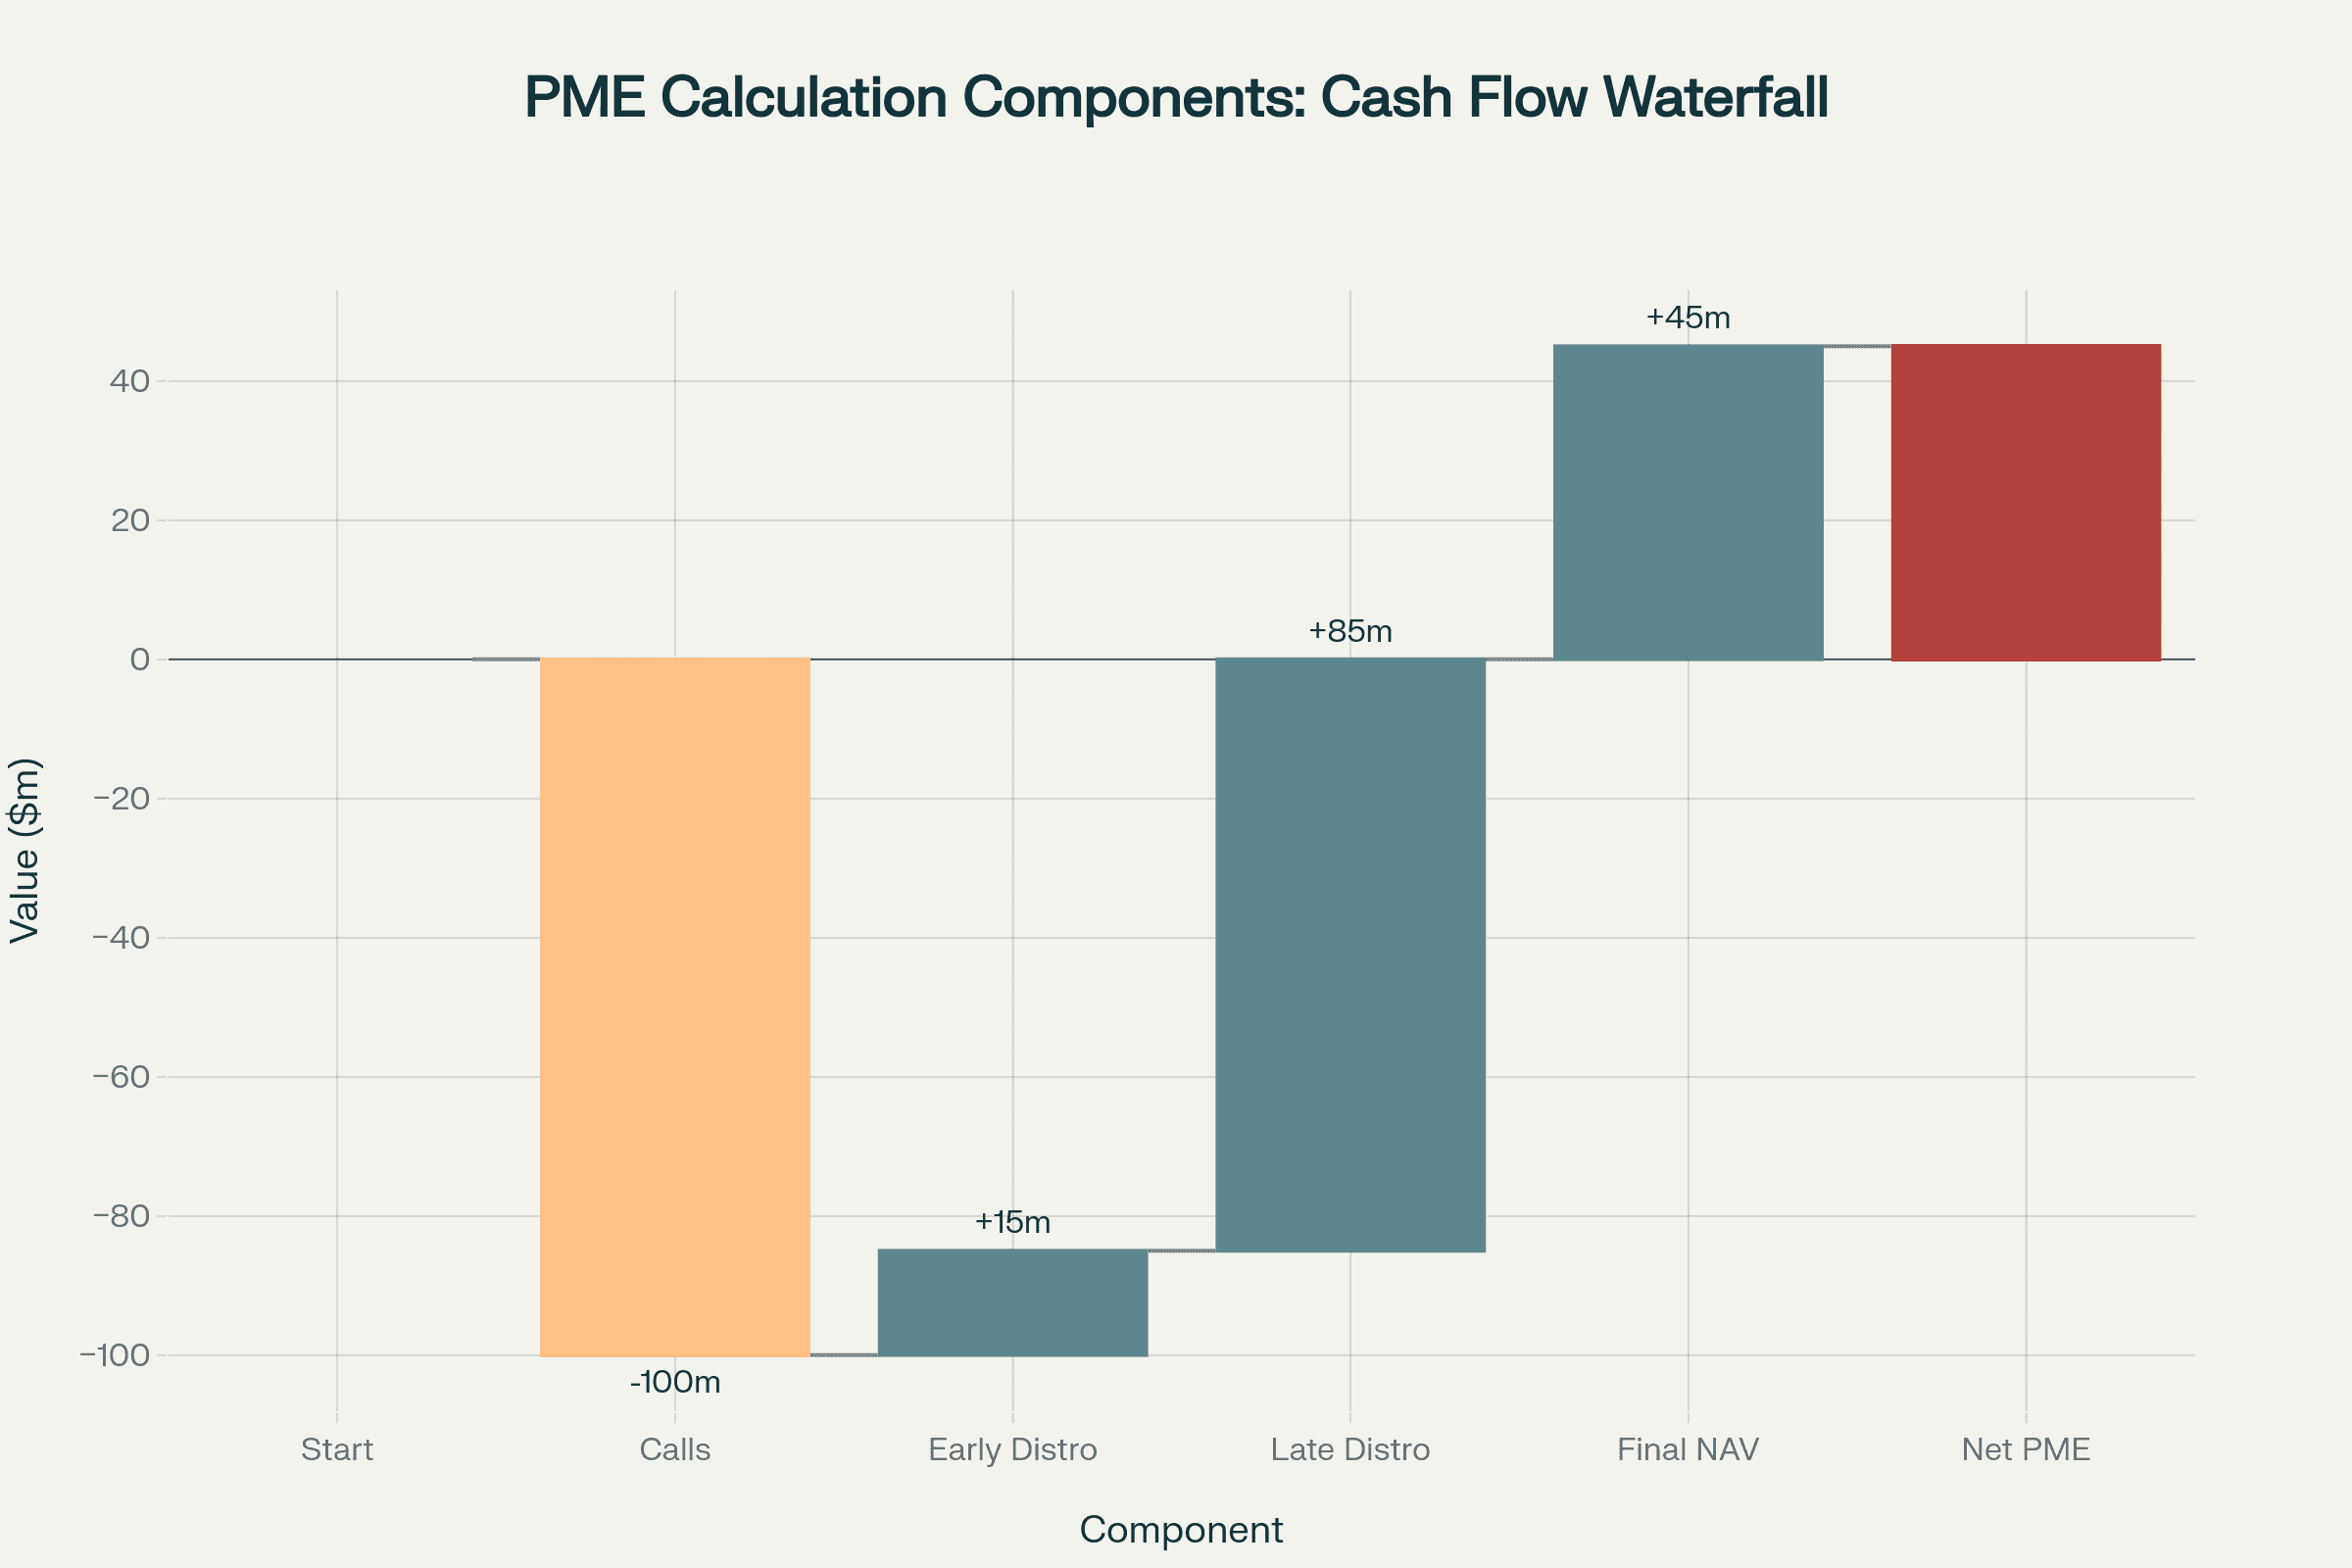
The methodology preserves both the timing and magnitude of cash flows, constructing a synthetic portfolio that grows or shrinks based on actual index performance. When a fund issues a capital call of $10 million, the PME model purchases $10 million worth of the benchmark index at that day's closing price. Similarly, when the fund distributes $15 million to investors, the model sells $15 million of index holdings. This cash flow matching ensures that performance differences reflect genuine value creation rather than timing effects.
The synthetic portfolio's terminal value represents what investors would have achieved through passive index investing with identical cash flow patterns. Comparing this value to actual private equity returns reveals whether active management and illiquidity premiums justify the higher fees and restricted liquidity of private markets. This comparison forms the foundation for informed allocation decisions across asset classes.
PME Calculation Methodologies
Long-Nickels PME (LN-PME)
The original PME methodology, developed by Austin Long and Craig Nickels in 1996, treats each capital call as purchasing index units and each distribution as selling them. The synthetic portfolio tracks index unit ownership throughout the fund's life, with the terminal value generating an IRR for direct comparison with the fund's actual IRR.
Consider a practical example: A fund calls $100 million when the S&P 500 trades at 2,000 points, purchasing 50,000 theoretical index units. A subsequent $50 million call at 2,400 points adds 20,833 units. When the fund distributes $75 million with the index at 2,800, it sells 26,786 units. The remaining units plus any residual NAV determine the final synthetic portfolio value.
The LN-PME calculation solves for the IRR where: NAV_PME = Σ (Cash Flow_s × (Index_T / Index_s))
Where Cash Flow_s represents cash flows, Index_T is the terminal index value, and Index_s is the index value at each cash flow date.
Kaplan-Schoar PME (KS-PME)
Introduced in 2005, the Kaplan-Schoar methodology calculates a performance ratio rather than an IRR spread. This approach divides the future value of all distributions (including terminal NAV) by the future value of all contributions, with each cash flow grown at the index return rate.
The formula expresses as: KS-PME = (Σ (Distributions_s × (Index_T / Index_s)) + NAV_T) / Σ (Contributions_s × (Index_T / Index_s))
A KS-PME of 1.2 indicates the private equity investment generated 20% more wealth than the public market alternative. This ratio interpretation proves more intuitive than IRR spreads and remains mathematically defined even when LN-PME encounters negative NAV issues. The methodology's robustness makes it particularly valuable for funds with exceptional performance or unusual cash flow patterns.
PME+ Methodology
Developed by Christophe Rouvinez in 2002, PME+ addresses the "shortness issue" where strong outperformance drives synthetic NAV negative. The methodology scales all distributions by a constant factor lambda (λ) to ensure the final synthetic NAV matches the fund's actual NAV.
The scaling factor calculation: λ = (Σ (Calls_s × Index_T / Index_s) – NAV_PE_T) / Σ (Distributions_s × Index_T / Index_s)
This approach preserves the intuitive IRR comparison while preventing mathematical anomalies. However, constant scaling can distort early distributions' impact, potentially masking timing-related performance drivers.
Modified PME (mPME)
Cambridge Associates introduced mPME in 2013 with time-varying distribution weights. Rather than applying constant scaling, mPME adjusts distributions proportionally at each period based on the ratio of distributions to total value (distributions plus NAV).
The weight at time t equals: Weight_t = Distributions_t / (Distributions_t + NAV_t)
This dynamic approach better reflects actual fund economics but requires accurate interim valuations, making it sensitive to marking practices and valuation policies.
Direct Alpha
The most recent innovation, Direct Alpha (2014), directly estimates annualized excess returns by solving for the continuous-time outperformance rate. Unlike other methods that provide approximations or ratios, Direct Alpha calculates the exact annualized alpha:
NAV_PE = Σ (Cash Flow_i × (Index_T / Index_i) × e^(α × (T - t_i)))
This methodology aligns with modern portfolio theory and provides precise outperformance measurement. Direct Alpha remains mathematically defined for all cash flow patterns and offers superior accuracy, particularly for funds with irregular or extreme cash flows.

Practical Applications and Implementation
Asset Allocation Decisions
Limited partners employ PME analysis to inform strategic allocation between private and public markets. When PME consistently indicates underperformance across a manager's funds, investors may reduce private market exposure in favor of liquid alternatives. Conversely, persistent outperformance justifies maintaining or increasing illiquid allocations despite liquidity constraints.
Portfolio construction models increasingly incorporate PME-based expected returns, adjusting for systematic differences between private and public markets. This integration enables more sophisticated optimization that accounts for the true opportunity cost of private market investments.
GP Selection and Due Diligence
While PME measures overall fund performance, isolating general partner skill requires additional analysis. Investors complement PME with value bridge analyses that decompose returns into market appreciation, multiple expansion, and operational improvements. This decomposition reveals whether outperformance stems from market timing, leverage optimization, or genuine operational value creation.
Due diligence processes now routinely calculate multiple PME variants to stress-test performance claims. Significant divergence between methodologies signals unusual cash flow patterns warranting deeper investigation.
Performance Reporting Standards
Industry organizations increasingly standardize PME reporting to enhance transparency and comparability. The Institutional Limited Partners Association (ILPA) recommends reporting both KS-PME ratios and Direct Alpha alongside traditional metrics. This multi-metric approach provides stakeholders with comprehensive performance perspectives while acknowledging each measure's limitations.
Index Selection Considerations
Appropriate benchmark selection proves critical for meaningful PME analysis. Global buyout funds typically benchmark against broad indices like MSCI World, while sector-specific funds require specialized benchmarks. A healthcare-focused fund benchmarked against the S&P 500 might show spurious outperformance simply due to sector allocation rather than manager skill.
Geographic considerations further complicate index selection. European funds benchmarked against U.S. indices incorporate currency effects that obscure underlying performance. Best practice involves calculating PME against multiple relevant indices to isolate various performance drivers.
Technical Considerations and Limitations
The Shortness Issue
Approximately 5-6% of funds encounter negative synthetic NAV when distributions exceed the theoretical index investment value. This "shortness" occurs when funds significantly outperform their benchmarks, paradoxically penalizing exceptional performance. While PME+ and mPME address this mathematically, the underlying issue highlights PME's limitations for extreme outperformers.
Ex-Post Analysis Limitations
PME calculations use realized index returns, making them purely retrospective measures. This backward-looking nature limits PME's utility for forward-looking allocation decisions. Investors cannot assume historical PME relationships will persist, particularly across market regime changes.
Implicit Beta Assumptions
Standard PME calculations implicitly assume beta equals 1.0, ignoring systematic risk differences between private and public investments. Private equity's use of leverage, concentration, and illiquidity suggests higher systematic risk that PME doesn't capture. Risk-adjusted PME variants attempt to address this limitation but lack market consensus on appropriate adjustments.
Data Quality Requirements
Accurate PME calculation demands precise cash flow timing and amounts. Even minor errors in dating can significantly impact results, particularly for funds with concentrated cash flows. Missing or estimated interim valuations further compromise accuracy, especially for methodologies like mPME that rely on periodic NAV measurements.
Common Questions About Public Market Equivalent
How should investors interpret negative PME values or undefined calculations? Negative PME values typically indicate the shortness issue where exceptional outperformance drives synthetic NAV negative. Rather than interpreting these as poor performance, investors should switch to alternative methodologies like KS-PME or PME+ that remain mathematically defined. The occurrence itself signals strong outperformance requiring more sophisticated analysis.
What role does currency play in international PME calculations? Currency effects significantly impact cross-border PME analysis. Best practice involves calculating PME in both fund currency and investor base currency, explicitly showing currency contribution to returns. Some investors apply currency hedging assumptions, though this adds complexity and may not reflect actual investment practices.
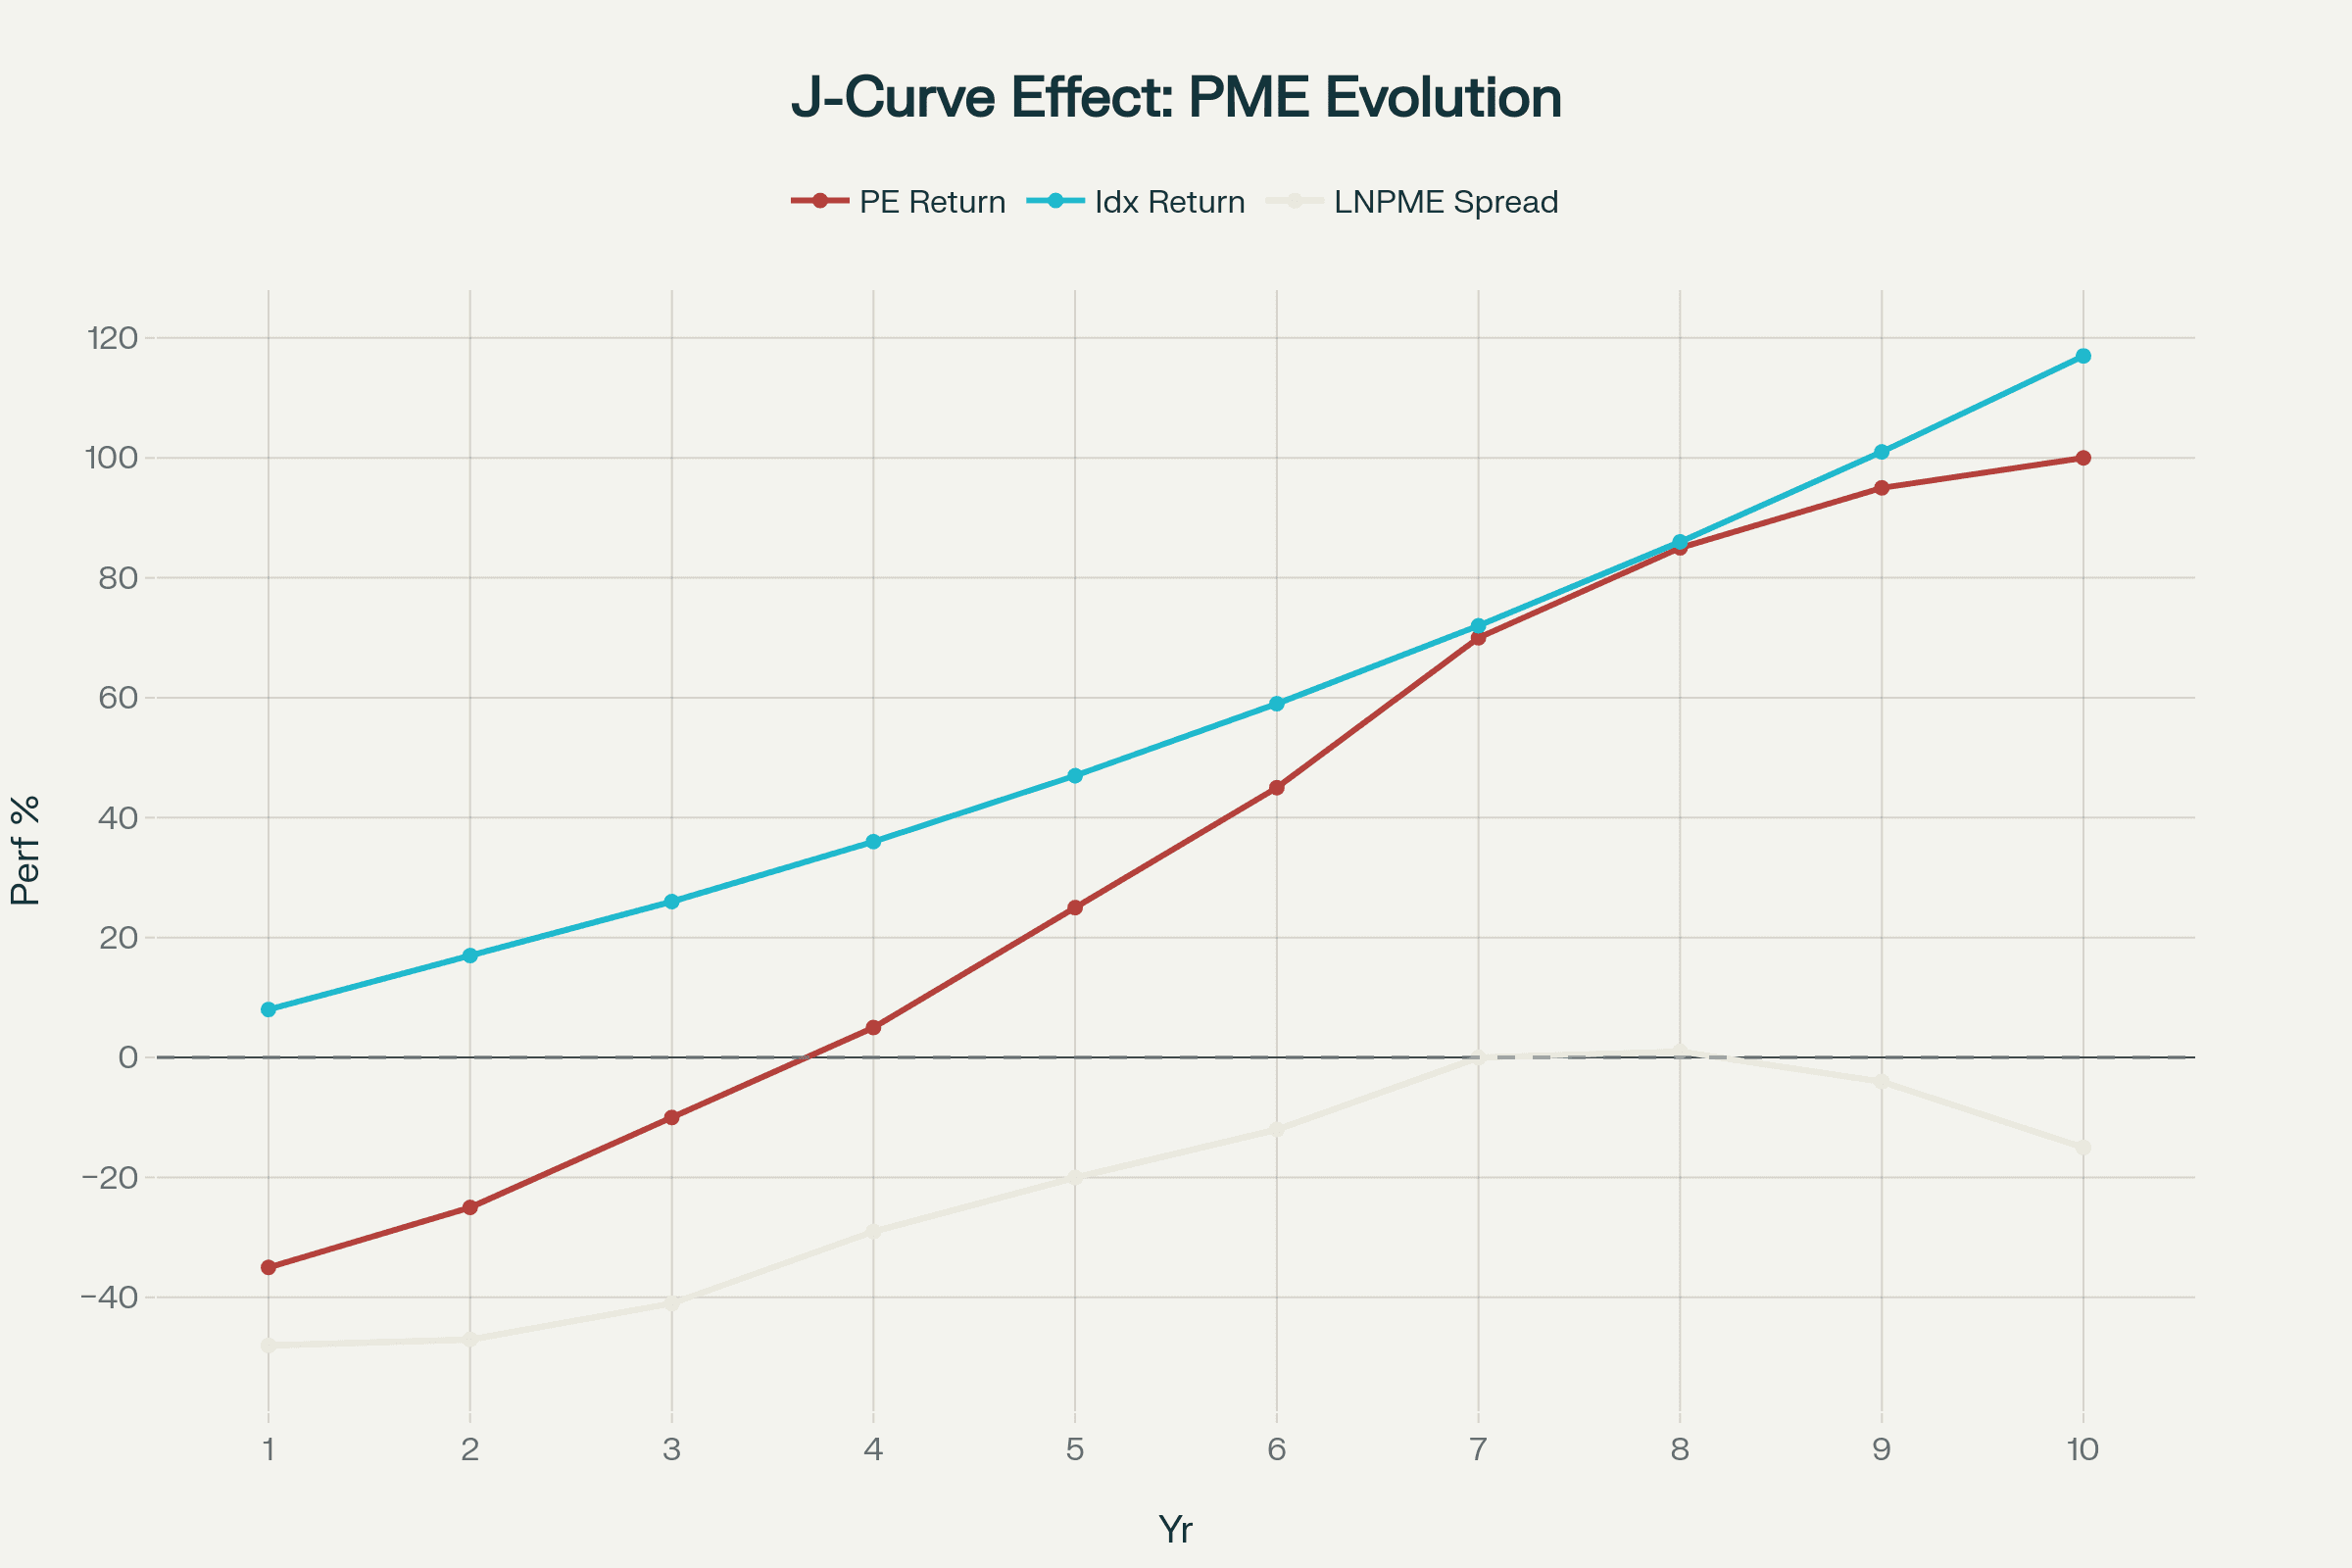
How do J-curve effects impact interim PME measurements? Early-stage negative returns create misleading PME values during initial investment periods. The J-curve effect can show severe underperformance in years 1-3 that reverses dramatically in later periods. Investors should avoid overweighting interim PME calculations, focusing instead on mature fund comparisons or cohort analyses that account for lifecycle effects.
Can PME methodologies apply to open-ended fund structures? While designed for closed-end funds, PME concepts extend to open-ended structures with modifications. The challenge lies in defining measurement periods and handling continuous subscriptions/redemptions. Practitioners often use rolling period analyses or cohort-based approaches, though these lack the elegance of closed-end applications.
How do secondaries transactions affect PME calculations? Secondary purchases complicate PME by introducing new cost bases at different points in fund lifecycles. Buyers should calculate PME from their entry point rather than fund inception, though this limits comparability with primary investors. Some investors maintain dual calculations showing both inception-to-date and entry-to-date performance.
Conclusion
Public Market Equivalent methodologies have evolved from simple cash flow matching to sophisticated frameworks quantifying private market alpha. While each variant addresses specific technical challenges, the collective toolkit enables nuanced performance evaluation accounting for private markets' unique characteristics. Direct Alpha's theoretical rigor offers the most precise measurement, though simpler methods like KS-PME provide intuitive insights sufficient for many applications. Success requires selecting appropriate methodologies for specific analytical needs while understanding inherent limitations. As private markets grow increasingly important in institutional portfolios, PME analysis becomes essential for informed allocation decisions and performance evaluation.


