

Internal Rate of Return (IRR) is one of the most widely used metrics to evaluate investment performance over time—especially in private equity and venture capital. It represents the annualized rate of return that sets the net present value (NPV) of future cash flows to zero. This guide covers how IRR is calculated, how to interpret it, and when it can be misleading in long-term, illiquid investments.
Key Takeaways
- IRR represents the discount rate that makes an investment's NPV equal to zero, essentially showing the breakeven interest rate where the present value of inflows equals the initial investment
- A higher IRR indicates a more attractive investment opportunity, with most investors comparing IRR to their required rate of return (hurdle rate) or weighted average cost of capital (WACC)
- IRR calculations assume all cash flows are reinvested at the same IRR rate, which can overstate actual returns in high-IRR scenarios
- Multiple IRRs can exist for investments with alternating positive and negative cash flows, requiring careful analysis or alternative metrics like MIRR
- While IRR is valuable for comparing similar-sized investments, it should be used alongside NPV and other metrics for comprehensive evaluation, especially when comparing projects of different scales
What Is Internal Rate of Return (IRR)?
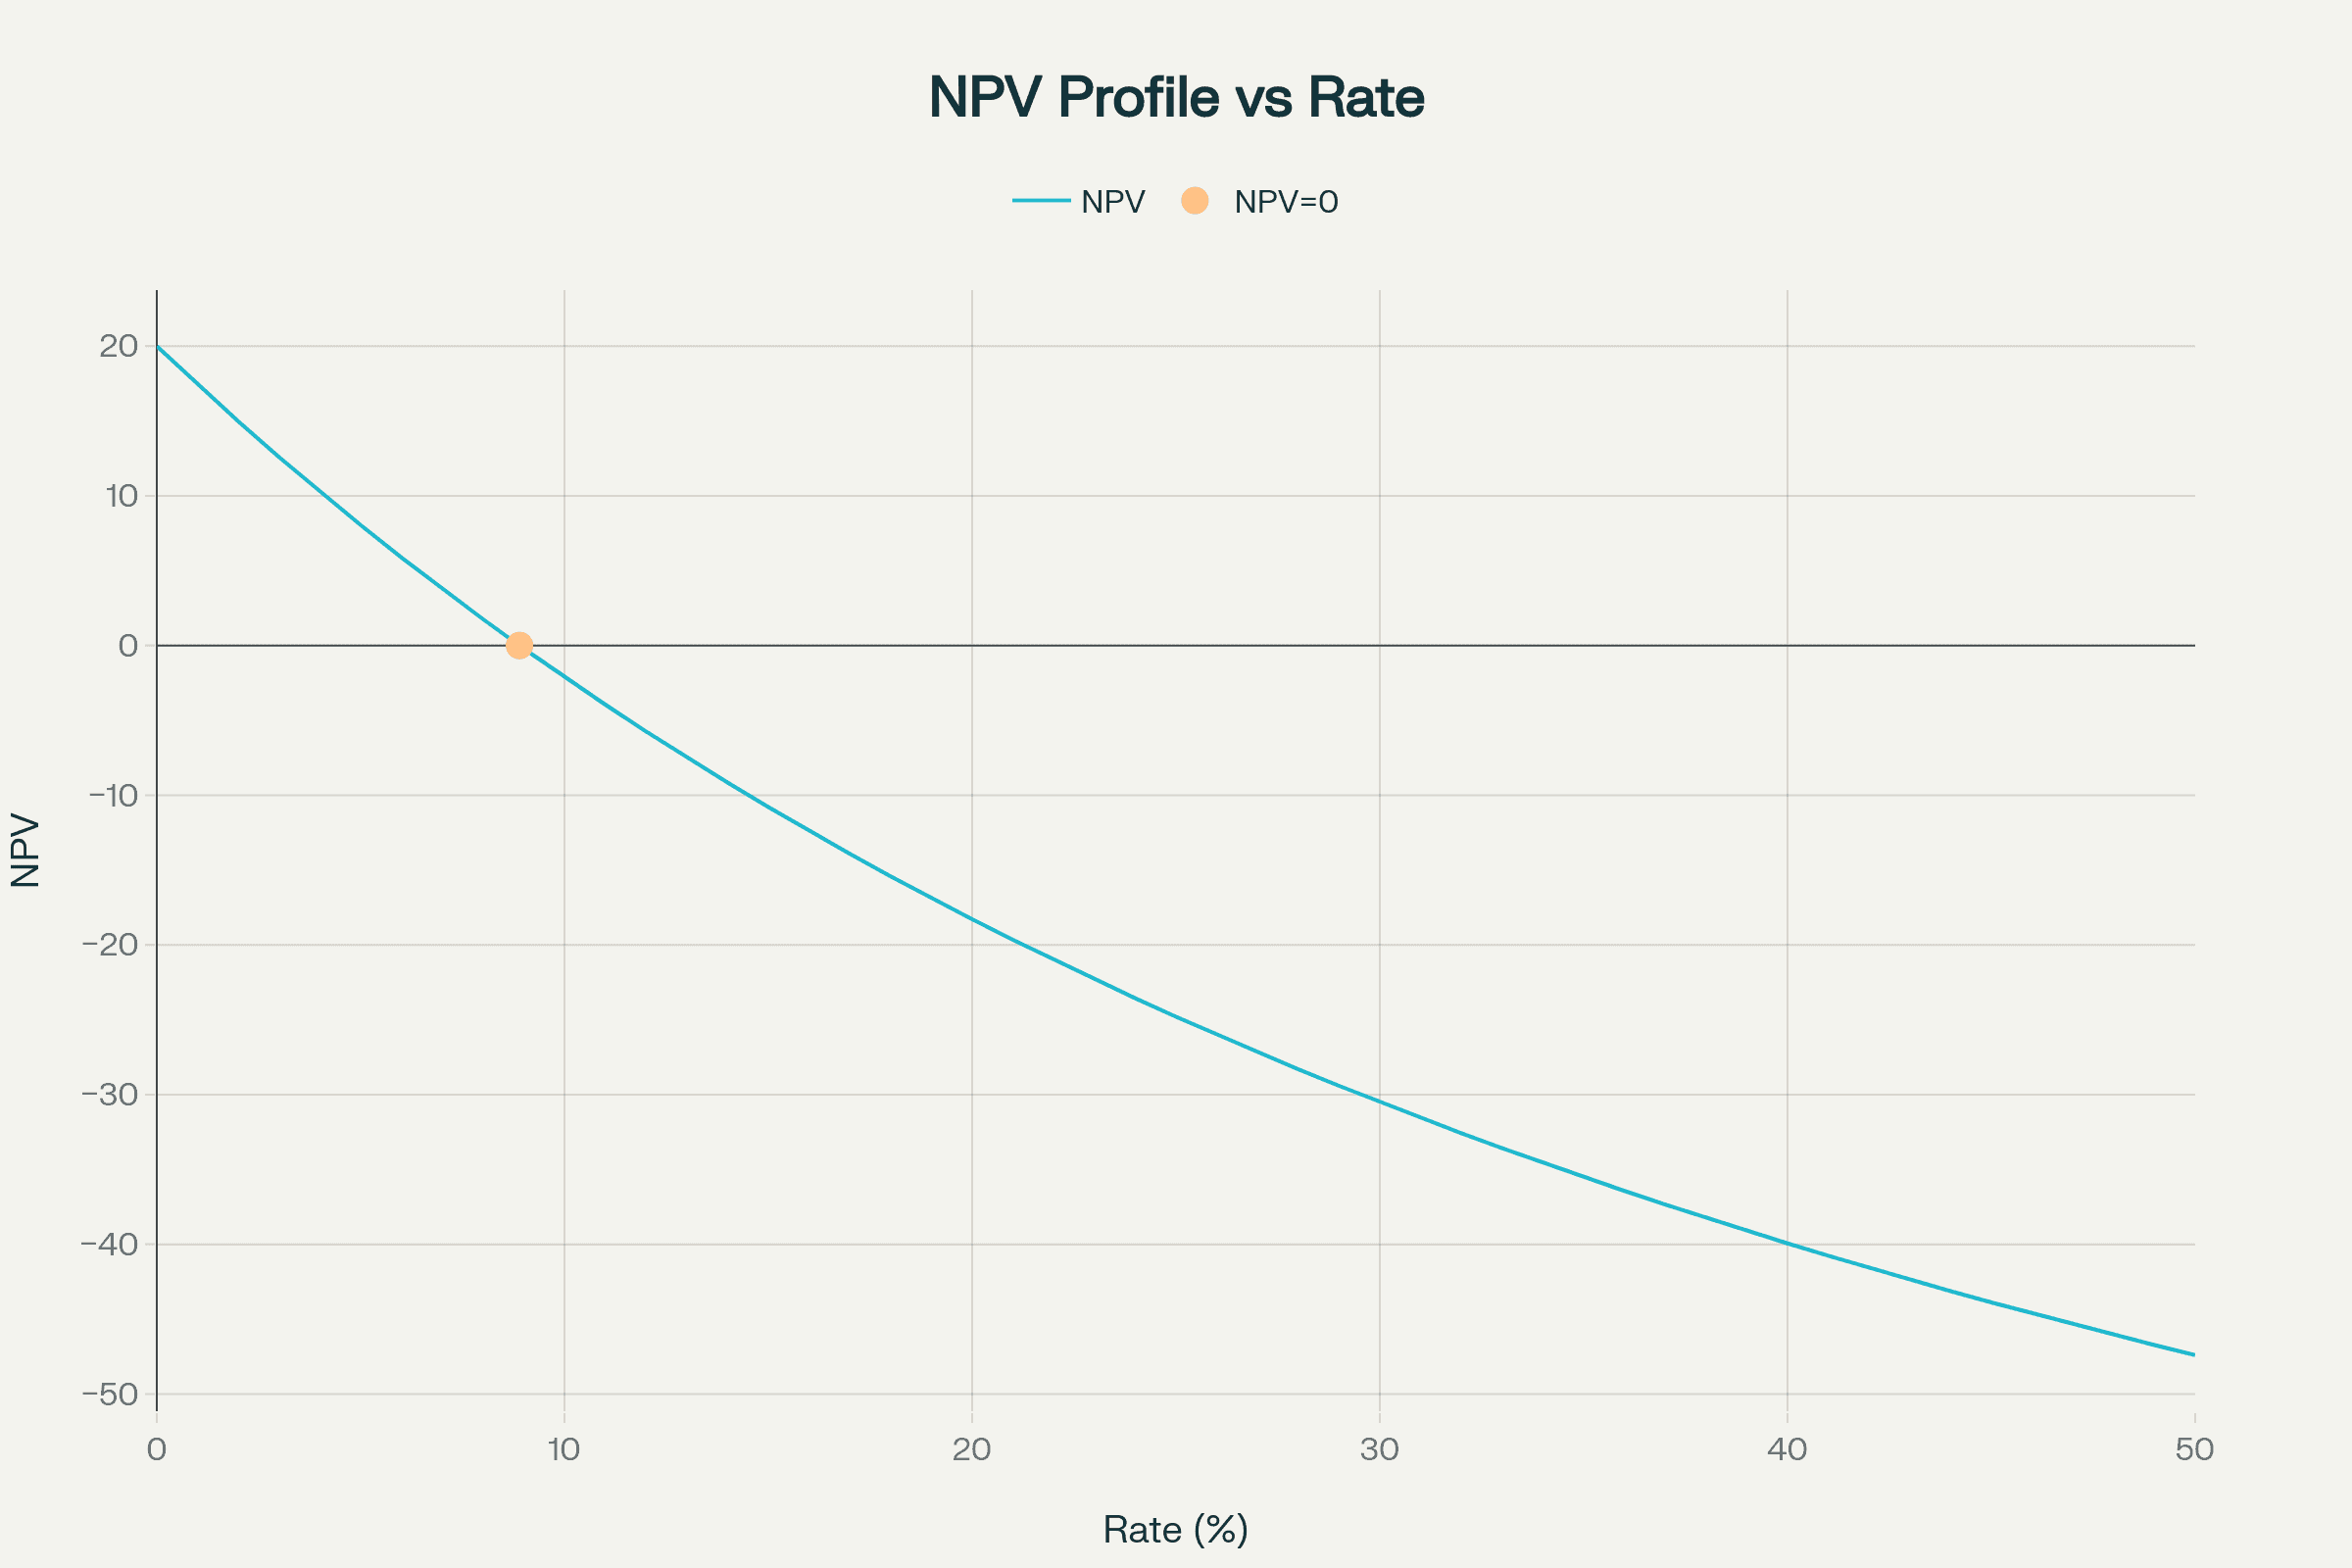
Internal Rate of Return measures the profitability of potential investments by calculating the discount rate that makes the net present value (NPV) of all cash flows equal to zero. The term "internal" signifies that the calculation excludes external factors such as inflation, the risk-free rate, or the cost of capital. IRR is also known as the discounted cash flow rate of return (DCFROR) or yield rate.
Think of IRR as the compound annual growth rate that an investment is expected to generate over its lifetime. When you invest capital today, you expect returns that compensate for both the opportunity cost and risk. IRR quantifies this expected return as a single percentage, making it easier to compare different investment opportunities regardless of their size, duration, or cash flow patterns.
The mathematical foundation of IRR lies in the time value of money principle. For example, if a project has an IRR of 15%, it means the investment is expected to grow at an annualized rate of 15% over its lifetime, accounting for all cash inflows and outflows. This standardization allows investors to quickly assess whether an opportunity meets their return requirements.
The IRR Formula and Calculation Process
The IRR formula sets the NPV equation to zero and solves for the discount rate:
0 = NPV = Σ [CFt ÷ (1 + IRR)^t] - C0
Where:
- CFt = Net cash inflow during period t
- C0 = Initial investment cost
- IRR = Internal rate of return
- t = Time period
Since this equation creates a polynomial of degree n (where n is the number of periods), it cannot be solved algebraically for IRR. Financial professionals use iterative methods:
-
Manual Trial and Error: Select two estimated discount rates, calculate NPV for each rate, then adjust based on whether NPV is positive or negative. Continue iterating until NPV approaches zero.
-
Excel IRR Function: Use
=IRR(values, [guess])where values represent the cash flow series starting with the initial investment (negative value) and guess is an optional starting estimate (default 10%). -
Financial Calculators: Input cash flow series and compute IRR directly using built-in algorithms.
-
Newton-Raphson Method: For complex scenarios requiring precise calculations, this mathematical approach uses derivatives to converge on the solution rapidly.
Practical IRR Calculation Example
Consider a manufacturing equipment investment:
- Initial investment: $500,000
- Year 1 cash flow: $120,000
- Year 2 cash flow: $150,000
- Year 3 cash flow: $180,000
- Year 4 cash flow: $200,000
- Year 5 cash flow: $220,000
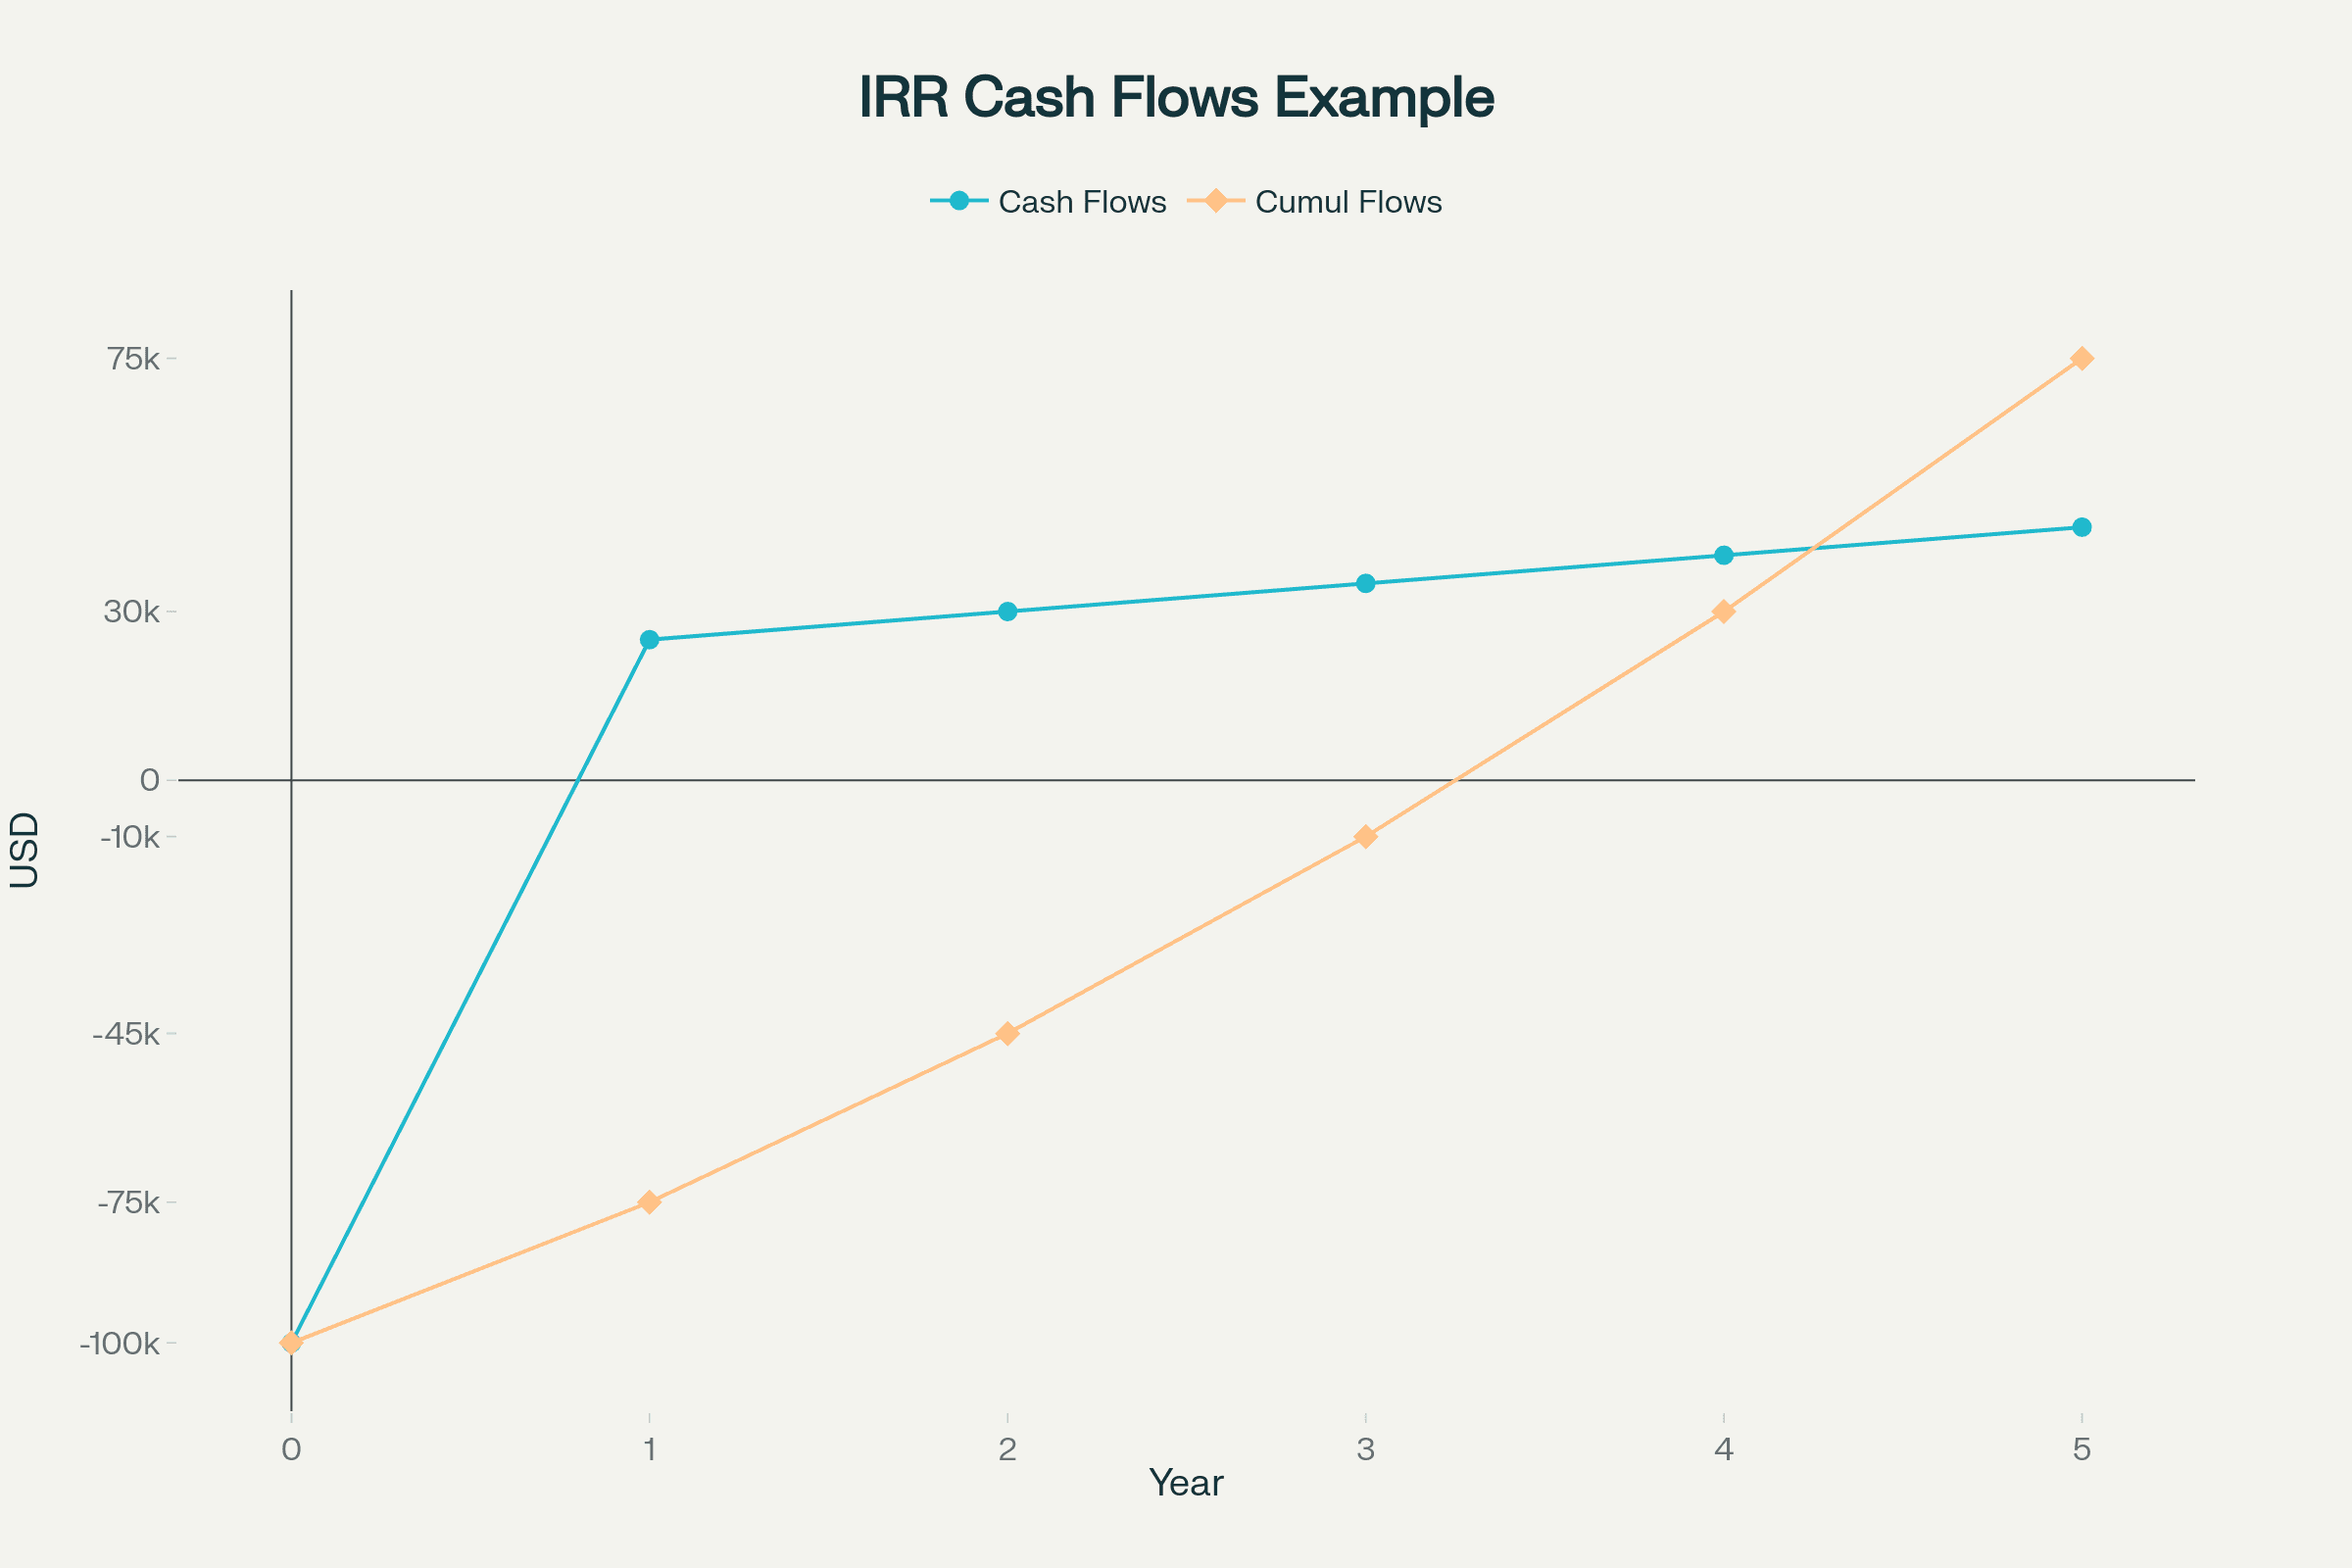
Using Excel's IRR function with these cash flows yields an IRR of approximately 19.86%. This means the investment is expected to generate a 19.86% annual return when considering all cash flows and their timing.
For manual verification, you would test different rates:
- At 15%: NPV = $61,532 (positive, so IRR > 15%)
- At 25%: NPV = -$65,984 (negative, so IRR < 25%)
- At 19.86%: NPV ≈ $0 (confirming the IRR)
Interpreting IRR Results
IRR interpretation follows a decision framework based on comparison benchmarks:
Basic Decision Rules:
- IRR > Cost of Capital: Accept the project as it generates economic value
- IRR < Cost of Capital: Reject the project as returns fall short of requirements
- IRR = Cost of Capital: The project breaks even in economic terms
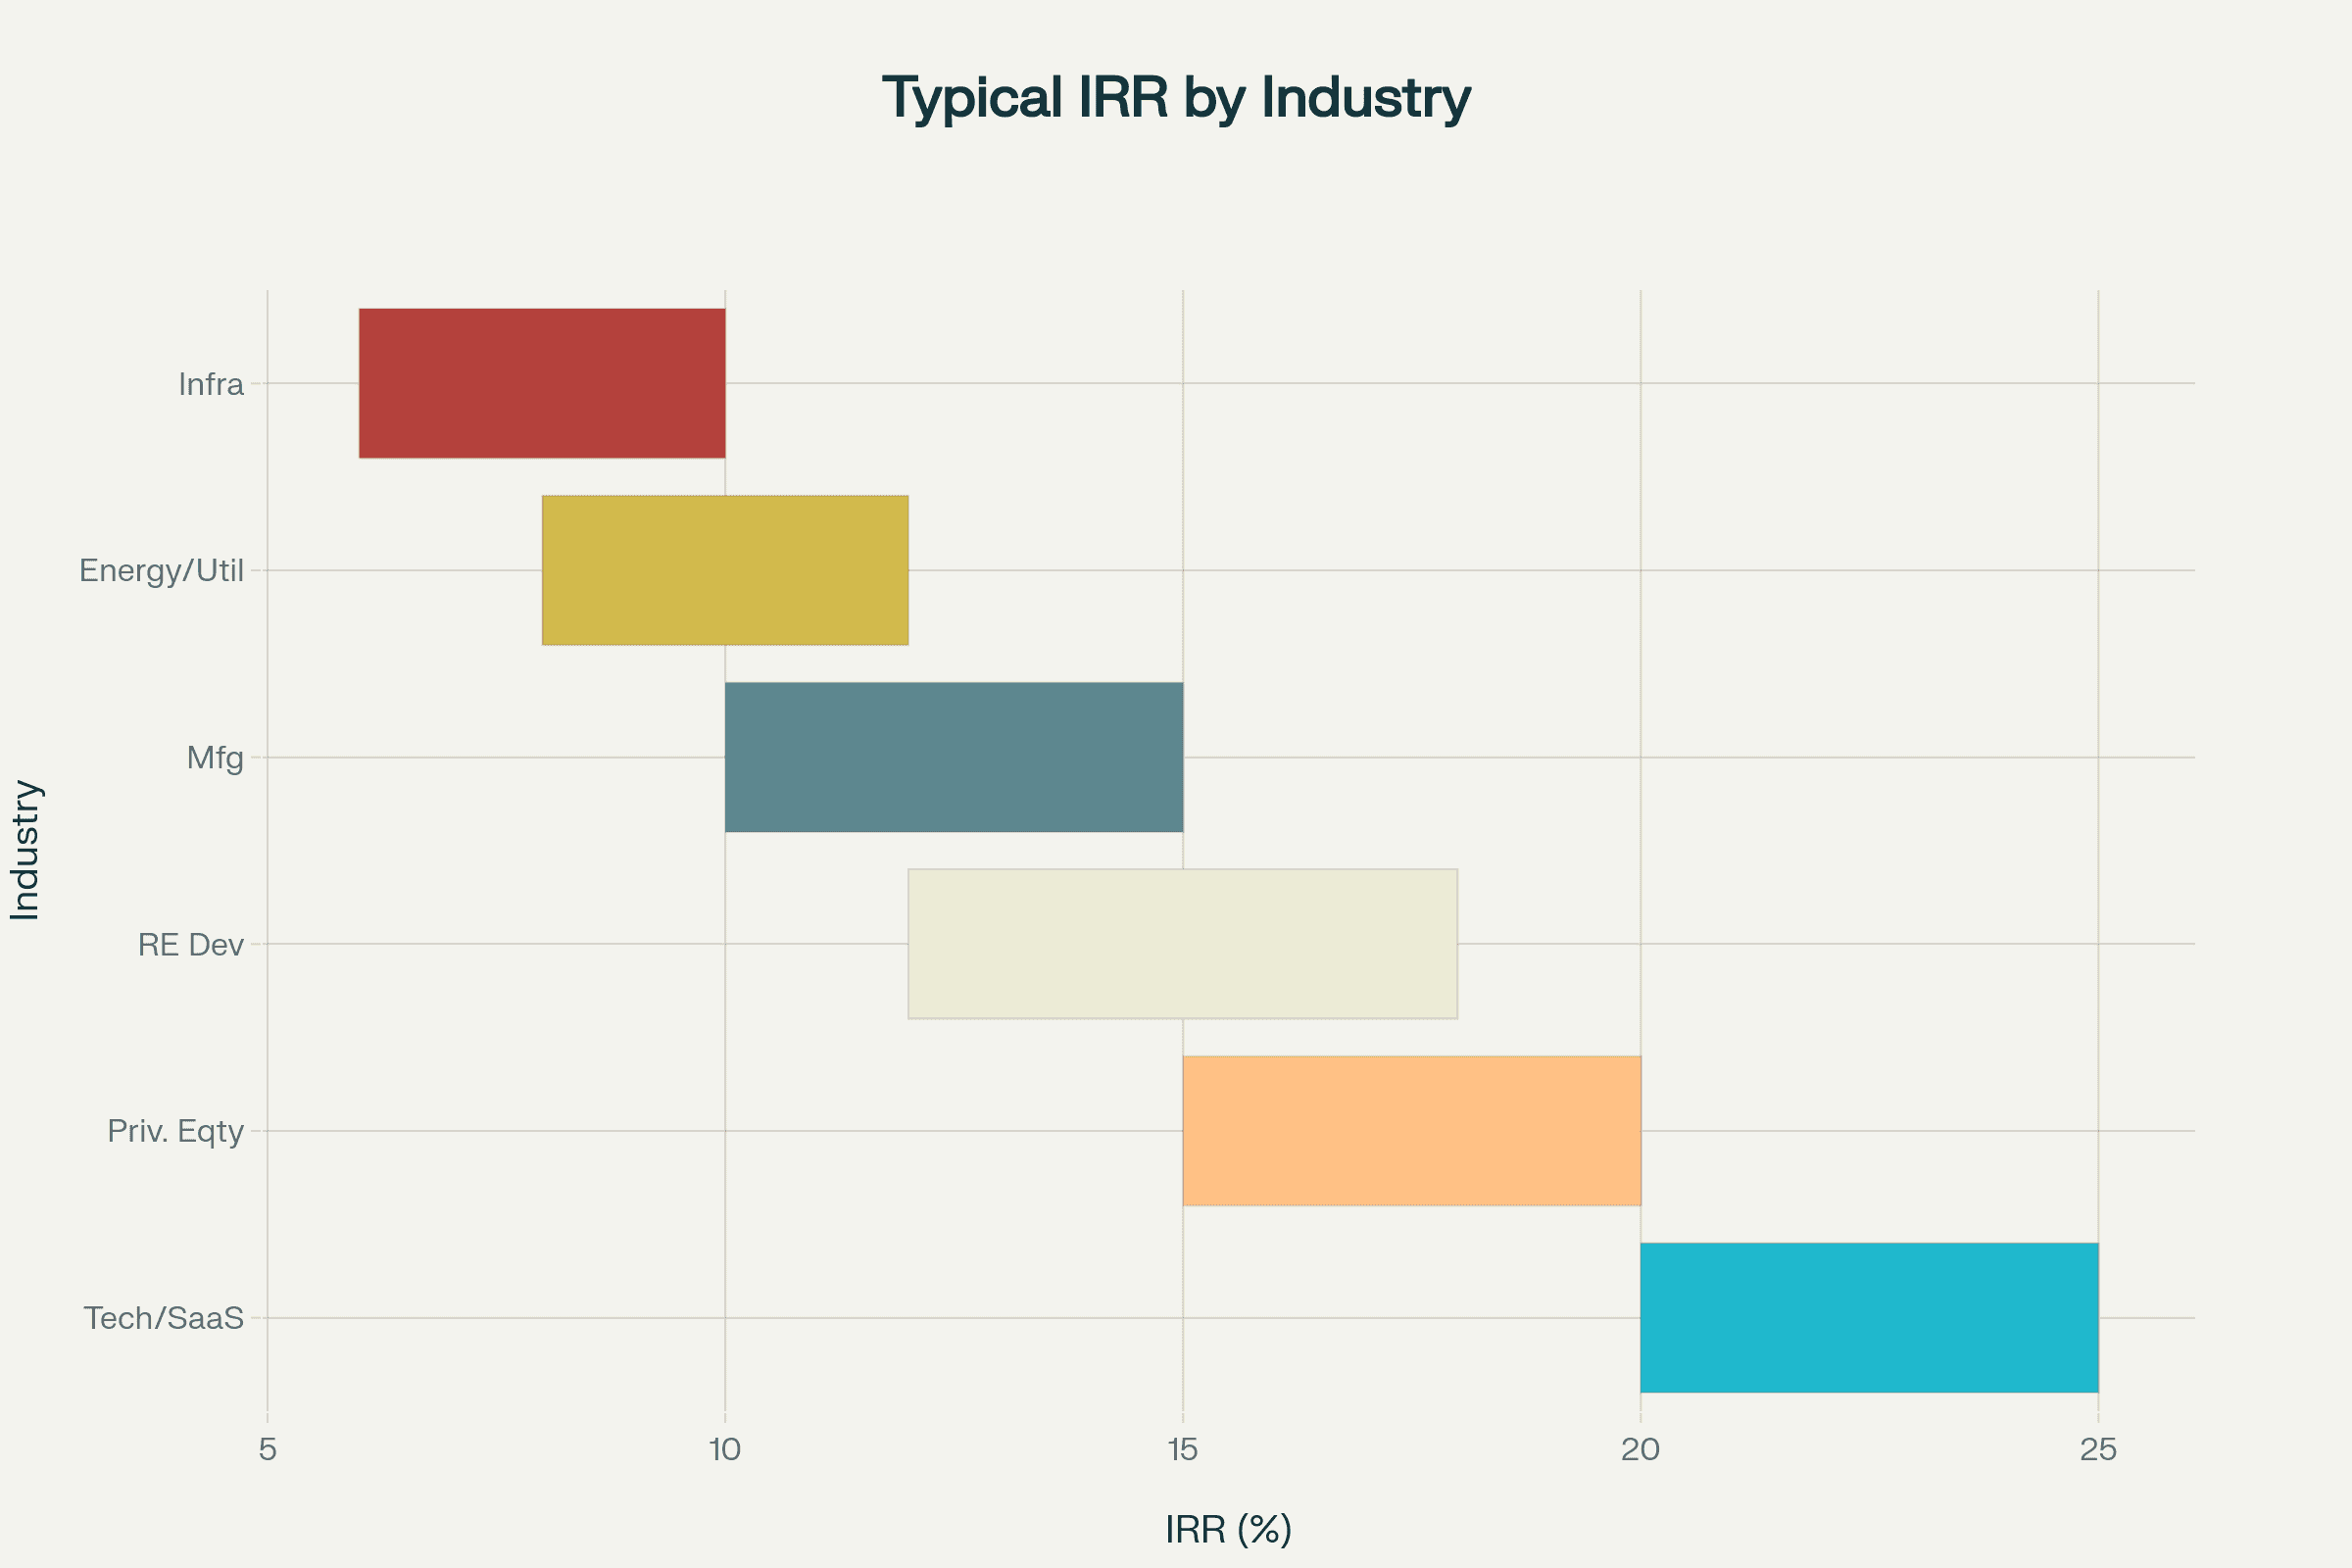
Risk-Adjusted Analysis: Higher-risk investments should generate higher IRRs to compensate investors. The required IRR premium over the risk-free rate varies by investment type:
Industry Benchmarks and Hurdle Rates:
- Government bonds: 2-5% (risk-free baseline)
- Corporate bonds: 5-10% (credit risk premium)
- Real estate development: 15-25% (development and market risk)
- Private equity buyouts: 20-30% (operational and financial leverage risk)
- Venture capital: 30-50% (startup and technology risk)
- Distressed debt: 25-40% (restructuring risk)
For real estate investments, IRR provides insight into risk-adjusted returns by considering both the timing and magnitude of cash flows throughout the investment lifecycle. A 20% IRR for a stable, income-producing property represents exceptional performance, while the same return for ground-up development might be considered marginal given higher risk.
IRR Limitations and Pitfalls
Despite its widespread use, IRR has several critical limitations that can lead to poor investment decisions if not properly understood:
The Reinvestment Rate Assumption: Traditional IRR calculations assume that all interim positive cash flows are reinvested at the same rate as the project's IRR. This becomes increasingly unrealistic as IRR rises. For example, a project generating 30% IRR assumes you can reinvest distributions at 30% annually—finding such opportunities consistently is virtually impossible. In reality, these funds are typically reinvested at the company's cost of capital or prevailing market rates, which are much lower.
Multiple IRR Problem: Projects with alternating positive and negative cash flows (non-conventional cash flows) can produce multiple IRR solutions or no real solution at all. This occurs because the IRR equation becomes a polynomial where each sign change can potentially create an additional root. Consider a mining project requiring initial investment, generating cash flows, then requiring substantial environmental cleanup costs—this pattern can result in two or more mathematically correct IRR values, making interpretation impossible.
Scale and Absolute Value Ignorance: IRR fails to account for the absolute scale of investments. A $10,000 investment with 50% IRR generates $5,000 in value, while a $1 million investment with 20% IRR generates $200,000. The latter creates 40 times more wealth despite the lower IRR. This limitation becomes critical when comparing mutually exclusive projects of different sizes.
Cash Flow Timing Sensitivity: Standard IRR calculations assume cash flows occur at regular intervals, typically annually at period-end. Real-world investments often generate irregular cash flows throughout the year. Additionally, IRR can favor projects with early cash flows over those with larger but later returns, potentially leading to suboptimal long-term value creation.
The Discount Rate Assumption: IRR assumes a constant discount rate throughout the project life, which may not reflect changing market conditions, interest rates, or risk profiles over time.
Advanced IRR Variations
To address traditional IRR limitations, financial professionals have developed several sophisticated variations:
Modified Internal Rate of Return (MIRR): MIRR addresses the unrealistic reinvestment assumption by incorporating separate rates:
- Finance rate: The cost at which negative cash flows are financed
- Reinvestment rate: The rate at which positive cash flows are reinvested (typically the firm's cost of capital)
The MIRR formula:
MIRR = [(FV of positive cash flows ÷ PV of negative cash flows)^(1/n)] - 1
MIRR provides several advantages:
- Eliminates multiple IRR problems by generating a single solution
- Uses realistic reinvestment assumptions based on market conditions
- Offers more accurate profitability assessment for capital budgeting decisions
Extended Internal Rate of Return (XIRR): XIRR handles investments with irregular cash flow timing by incorporating specific dates for each cash flow. Unlike standard IRR which assumes annual periods, XIRR calculates returns based on actual calendar dates. The Excel syntax is: =XIRR(values, dates, [guess])
XIRR is particularly valuable for:
- Venture capital and private equity investments with irregular distributions
- Real estate projects with sporadic rental income and capital expenditures
- Personal investment portfolios with varying contribution and withdrawal dates
Other Specialized Variations:
- Leveraged IRR: Measures returns specifically on equity after accounting for debt service
- Gross vs Net IRR: Gross IRR excludes fees and carried interest; net IRR reflects actual investor returns
- Money-Weighted Rate of Return (MWRR): Uses IRR methodology for portfolio performance measurement
- Hedged IRR: Accounts for currency exchange impacts in international investments
IRR vs NPV: Choosing the Right Metric
While IRR and Net Present Value both evaluate investment profitability using discounted cash flow analysis, they serve different purposes and can sometimes provide conflicting recommendations.
NPV measures absolute value creation in dollar terms, while IRR expresses returns as a percentage. The fundamental difference lies in their objectives: NPV maximizes wealth in absolute terms, while IRR maximizes the rate of return.
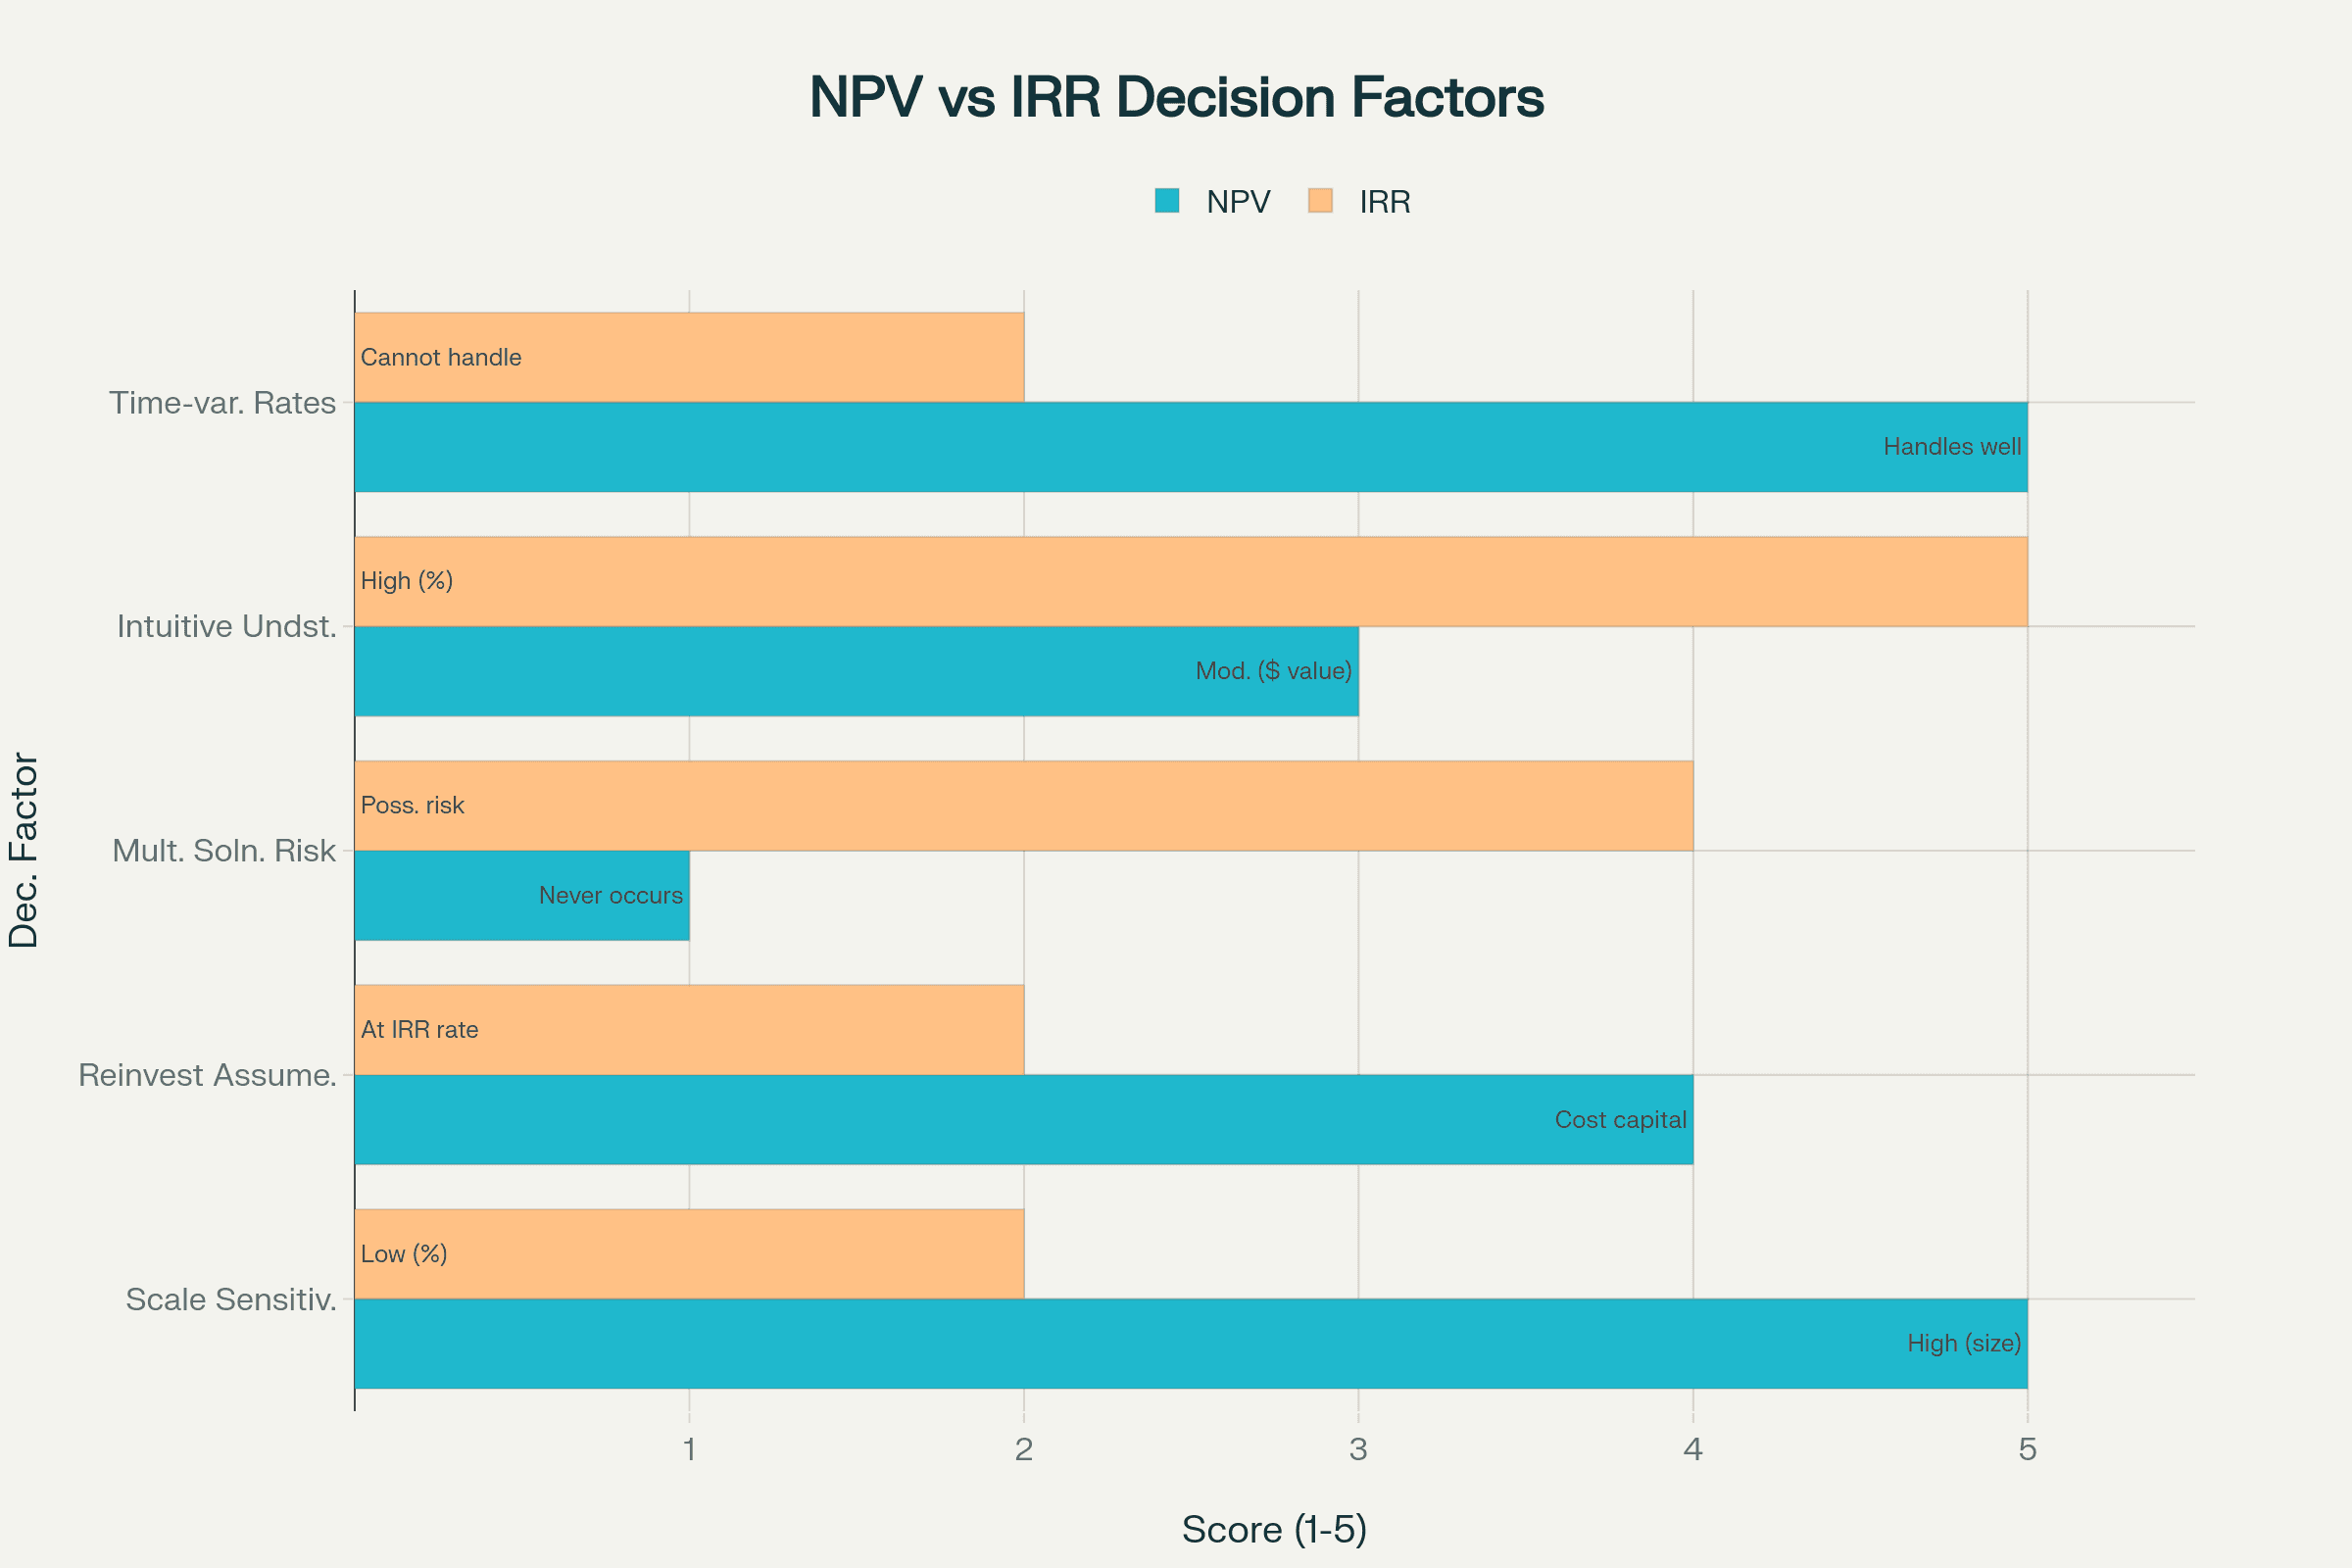
Key Differences in Application
NPV Advantages:
- Accounts for investment scale and absolute value creation
- Handles non-conventional cash flows without multiple solutions
- Incorporates the actual cost of capital in calculations
- Better for mutually exclusive project selection
IRR Advantages:
- Provides intuitive percentage returns for easy communication
- Enables quick comparison across different investment types
- Doesn't require explicit cost of capital estimation
- Useful for setting hurdle rates and performance benchmarks
Consider two mutually exclusive projects:
- Project A: Initial investment $100,000, IRR 25%, NPV at 10% discount rate: $50,000
- Project B: Initial investment $500,000, IRR 20%, NPV at 10% discount rate: $200,000
While Project A has higher IRR, Project B creates four times more value and would be preferred using NPV criteria. This illustrates why sophisticated investors use both metrics together.
When to Prioritize Each Metric
Use IRR When:
- Comparing investments of similar size and risk profile
- Capital is constrained and efficiency matters most
- Communicating returns to stakeholders unfamiliar with NPV concepts
- Evaluating fund or manager performance against benchmarks
- Setting minimum acceptable return thresholds
Use NPV When:
- Choosing between mutually exclusive projects
- Investment sizes differ significantly
- Cash flow patterns are complex or non-conventional
- Maximizing total shareholder value is the primary goal
- Discount rates vary over the project lifecycle
Real-World Applications Across Industries
Private Equity and Venture Capital: IRR serves as the primary performance metric in private equity, with firms typically targeting 20-30% gross IRR for buyouts and 30-50% for venture investments. Fund managers use IRR to demonstrate value creation and attract limited partners. Performance attribution analysis breaks down IRR into components: operational improvements, multiple expansion, and leverage effects.
Real Estate Development: Developers calculate project-level IRRs to secure financing and equity partners. Typical targets range from 15-20% for stabilized properties to 25-35% for ground-up development. Real estate professionals often use leveraged and unleveraged IRR to assess the impact of debt financing on equity returns.
Corporate Capital Budgeting: Companies use IRR to evaluate expansion projects, equipment purchases, and strategic investments. Projects must exceed the weighted average cost of capital (WACC) to create shareholder value. Many firms establish IRR hurdles by investment type: 12-15% for replacement capital, 15-20% for expansion, and 20%+ for new ventures.
Energy and Infrastructure: Long-term infrastructure projects use IRR to evaluate investments spanning decades. Energy companies compare IRRs when deciding between building new facilities versus upgrading existing ones. Typical hurdle rates range from 10-12% for regulated utilities to 15-20% for merchant power projects.
Technology and SaaS: Software companies evaluate R&D investments and customer acquisition strategies using IRR. A SaaS company investing $200,000 in automation yielding $75,000 annual savings over five years might achieve 24% IRR, guiding resource allocation decisions.
Calculating IRR in Excel and Financial Software
Excel provides comprehensive IRR calculation capabilities through multiple functions:
Basic IRR Function:
=IRR(B2:B7, [guess])
- B2:B7 contains cash flows (first value must be negative)
- Guess is optional (default 10%)
- Returns error if no solution exists within 20 iterations
XIRR for Irregular Timing:
=XIRR(B2:B7, A2:A7, [guess])
- A2:A7 contains dates corresponding to each cash flow
- Handles non-periodic investments accurately
- Essential for private equity and real estate analysis
MIRR with Separate Rates:
=MIRR(B2:B7, finance_rate, reinvest_rate)
- Finance_rate: Cost of funding negative cash flows
- Reinvest_rate: Return on positive cash flow reinvestment
- Provides more realistic return estimates
Advanced Techniques:
- Use Data Tables for sensitivity analysis across different scenarios
- Combine with OFFSET for dynamic cash flow ranges
- Implement VBA for complex, multi-stage IRR calculations
- Create templates with built-in error checking for "no IRR" scenarios
Professional software extends these capabilities:
- Bloomberg Terminal: Provides IRR analytics with market data integration
- Argus: Specialized for real estate with detailed cash flow modeling
- PitchBook: Private equity focused with benchmarking capabilities
- Python/R: Custom implementations for Monte Carlo simulations
Improving Investment IRR
Strategic approaches to enhance IRR focus on optimizing cash flow patterns and operational efficiency:
Accelerate Positive Cash Flows:
- Implement aggressive go-to-market strategies for faster revenue ramp
- Negotiate favorable payment terms with customers (upfront payments, shorter cycles)
- Focus on quick-win initiatives that generate immediate returns
- Use milestone-based pricing to front-load cash receipts
Optimize Capital Deployment:
- Stage investments to match value creation milestones
- Utilize vendor financing or leasing to reduce upfront capital
- Implement just-in-time capital calls in fund structures
- Consider modular project design for phased deployment
Operational Excellence:
- Reduce operating expenses through automation and efficiency
- Accelerate project timelines without compromising quality
- Implement lean methodologies to eliminate waste
- Focus on high-margin products or services
Portfolio Management:
- Regularly benchmark project IRRs against hurdle rates
- Divest underperforming assets early to minimize drag
- Reallocate capital from low to high IRR opportunities
- Use portfolio theory to optimize risk-adjusted returns
Financial Engineering:
- Optimize capital structure to enhance equity returns
- Time exits to maximize valuation multiples
- Use derivatives to hedge downside risks
- Structure deals with earn-outs to capture upside
Value Creation Strategies by Industry:
- Private Equity: Focus on EBITDA growth, multiple expansion, and optimal leverage
- Real Estate: Improve NOI through operational improvements and strategic renovations
- Venture Capital: Accelerate growth metrics that drive valuation in next funding round
- Corporate Projects: Reduce implementation time and capture synergies quickly
Common Questions About Internal Rate of Return
What's a good IRR for different investment types? IRR benchmarks vary significantly by asset class and risk level. Conservative investments like government bonds typically yield 2-5%, investment-grade corporate bonds target 5-10%, real estate development seeks 15-25%, private equity buyouts aim for 20-30%, while venture capital often requires 30-50% to compensate for high failure rates. Always compare IRR to risk-adjusted alternatives and your weighted average cost of capital.
How does IRR handle negative cash flows in the middle of an investment? Investments with negative cash flows after the initial investment (such as additional capital calls or major renovations) can create multiple IRRs or no real solution. The mathematical explanation is that each sign change in cash flows can create an additional polynomial root. In these cases, use Modified IRR (MIRR) or NPV analysis for clearer insights, as standard IRR calculations may provide misleading or ambiguous results.
Why might IRR and NPV give different investment recommendations? IRR and NPV can conflict when comparing projects of different sizes, durations, or cash flow patterns. IRR maximizes percentage return while NPV maximizes absolute dollar value. For mutually exclusive projects, NPV generally provides better guidance for wealth maximization. For example, a small project with 40% IRR might create less value than a large project with 15% IRR, making NPV the better decision criterion.
Can IRR be negative, and what does that mean? Yes, IRR can be negative when an investment loses money. A negative IRR means the investment's return is worse than simply holding cash—the present value of cash outflows exceeds inflows. This commonly occurs in failed ventures, poorly timed investments, or projects abandoned before completion. Negative IRR indicates value destruction rather than creation.
How do taxes and inflation affect IRR calculations? Standard IRR calculations typically use nominal, pre-tax cash flows. For more accurate analysis, calculate after-tax IRR using cash flows net of applicable taxes, and real IRR by adjusting for inflation. The relationship is: (1 + Nominal IRR) = (1 + Real IRR) × (1 + Inflation Rate). Professional investors often present both pre-tax and after-tax IRRs, with the spread depending on the applicable tax regime and structure.
Conclusion
Internal Rate of Return remains an indispensable metric in investment analysis, providing an intuitive percentage-based measure of investment performance. While its limitations—particularly the reinvestment assumption and potential for multiple solutions—require careful consideration, IRR's standardized approach to comparing diverse investment opportunities ensures its continued relevance. The development of variations like MIRR and XIRR addresses many traditional shortcomings while preserving IRR's core benefits. Success with IRR requires understanding both its mathematical foundation and practical applications across different investment contexts. By combining IRR with complementary metrics like NPV and using appropriate variations for specific situations, investors can make more informed decisions that balance return optimization with risk management. As financial markets evolve and investment structures become more complex, mastering IRR and its variations becomes increasingly critical for effective capital allocation and value creation.


