

TVPI, or Total Value to Paid-In Capital, measures the total value a fund has created—both realized and unrealized—relative to the capital invested by limited partners. It’s a core metric used in private equity and venture capital to evaluate performance throughout a fund’s life. This guide explains how TVPI is calculated, what it reveals about value creation, and how investors use it alongside DPI and IRR.
Key Takeaways
- TVPI measures total fund value (realized + unrealized) divided by capital contributed by investors
- A TVPI of 2.0x means the fund has doubled investor capital; below 1.0x indicates a loss
- Unlike IRR, TVPI doesn't consider time value of money but provides a clear snapshot of value creation
- Industry benchmarks vary: top-quartile VC funds typically achieve 3.0x+ TVPI over their lifetime
- TVPI = DPI (Distributed to Paid-In) + RVPI (Residual Value to Paid-In)
Understanding TVPI and Its Components
What Is TVPI?
TVPI represents the total value multiple of a private equity or venture capital fund. It answers a fundamental question: "For every dollar an investor has contributed, how much value exists in the fund today?"
The metric combines two essential components:
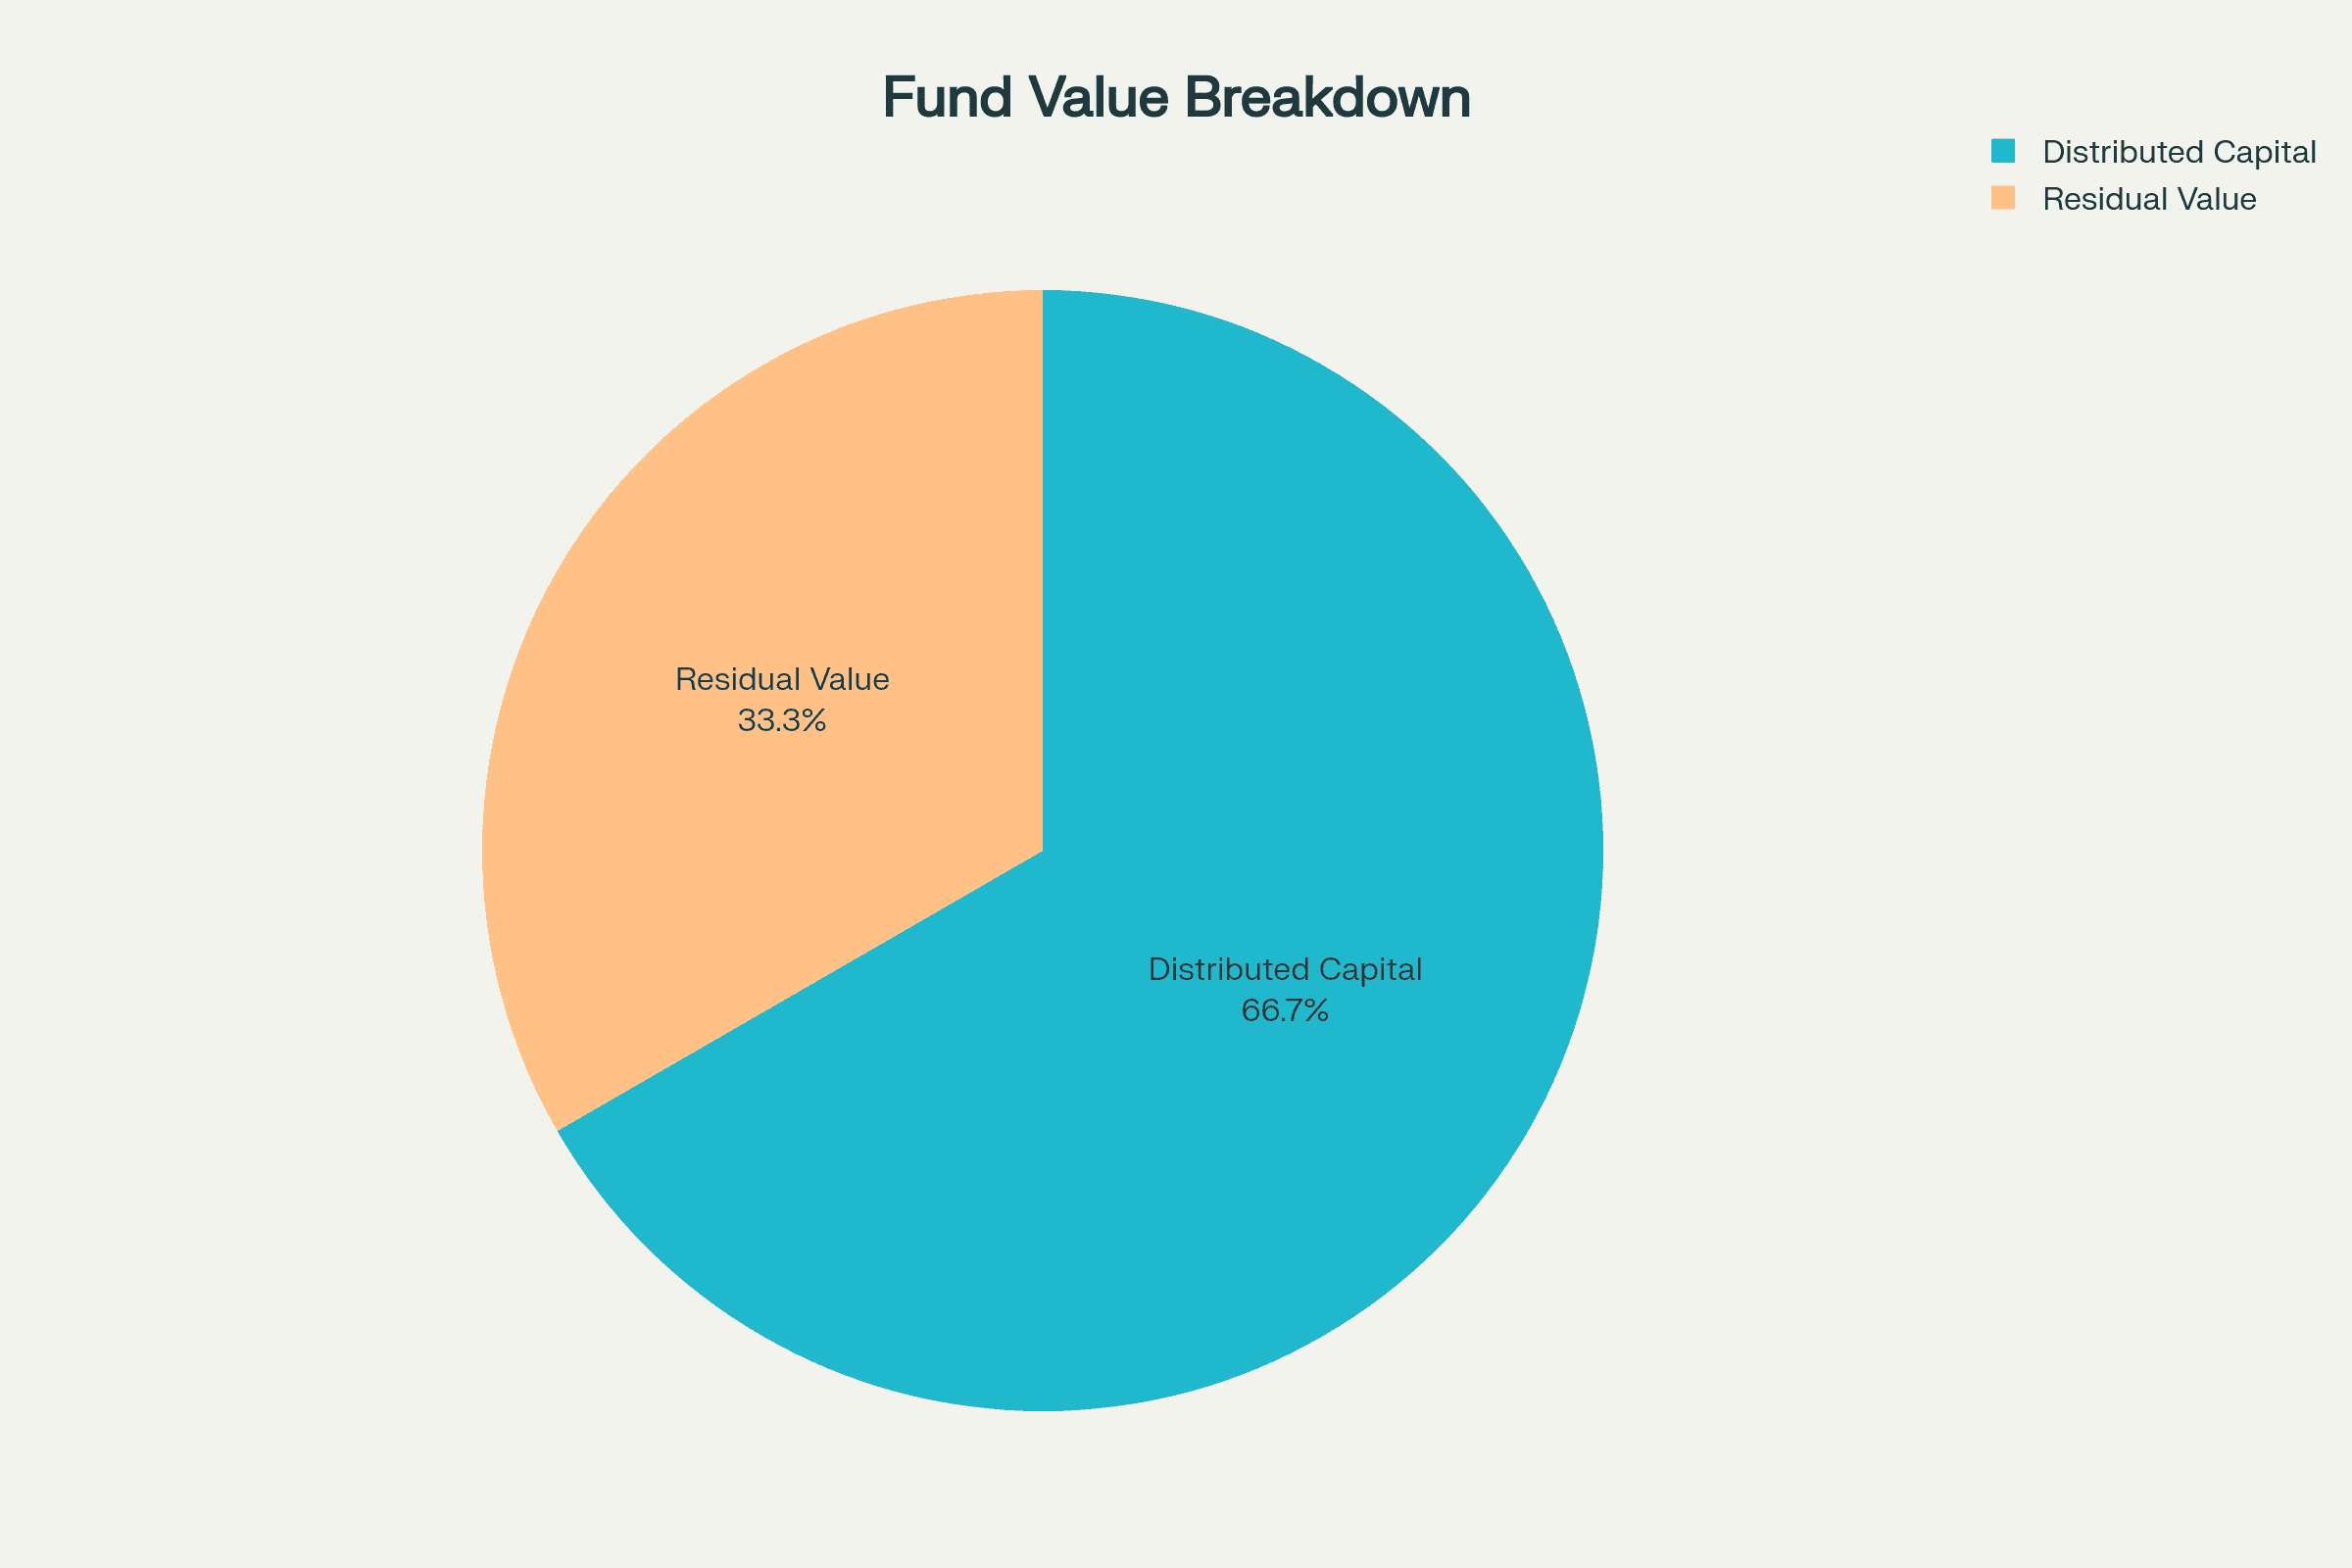
- Distributed capital: Money already returned to investors through exits
- Residual value: Current fair market value of remaining portfolio investments
The TVPI Formula
The calculation is straightforward:
TVPI = (Cumulative Distributions + Residual Value) / Paid-In Capital
Or expressed differently:
TVPI = DPI + RVPI
Where:
- DPI (Distributed to Paid-In): Cash returned to LPs / Total capital called
- RVPI (Residual Value to Paid-In): Portfolio NAV / Total capital called
Real-World Example
Consider a $100 million fund where:
- LPs have contributed $80 million (paid-in capital)
- The fund has distributed $40 million from exits
- Remaining portfolio value is $120 million
TVPI = ($40M + $120M) / $80M = 2.0x
This 2.0x TVPI indicates the fund has doubled investor capital on paper.
TVPI vs Other Performance Metrics
TVPI vs IRR
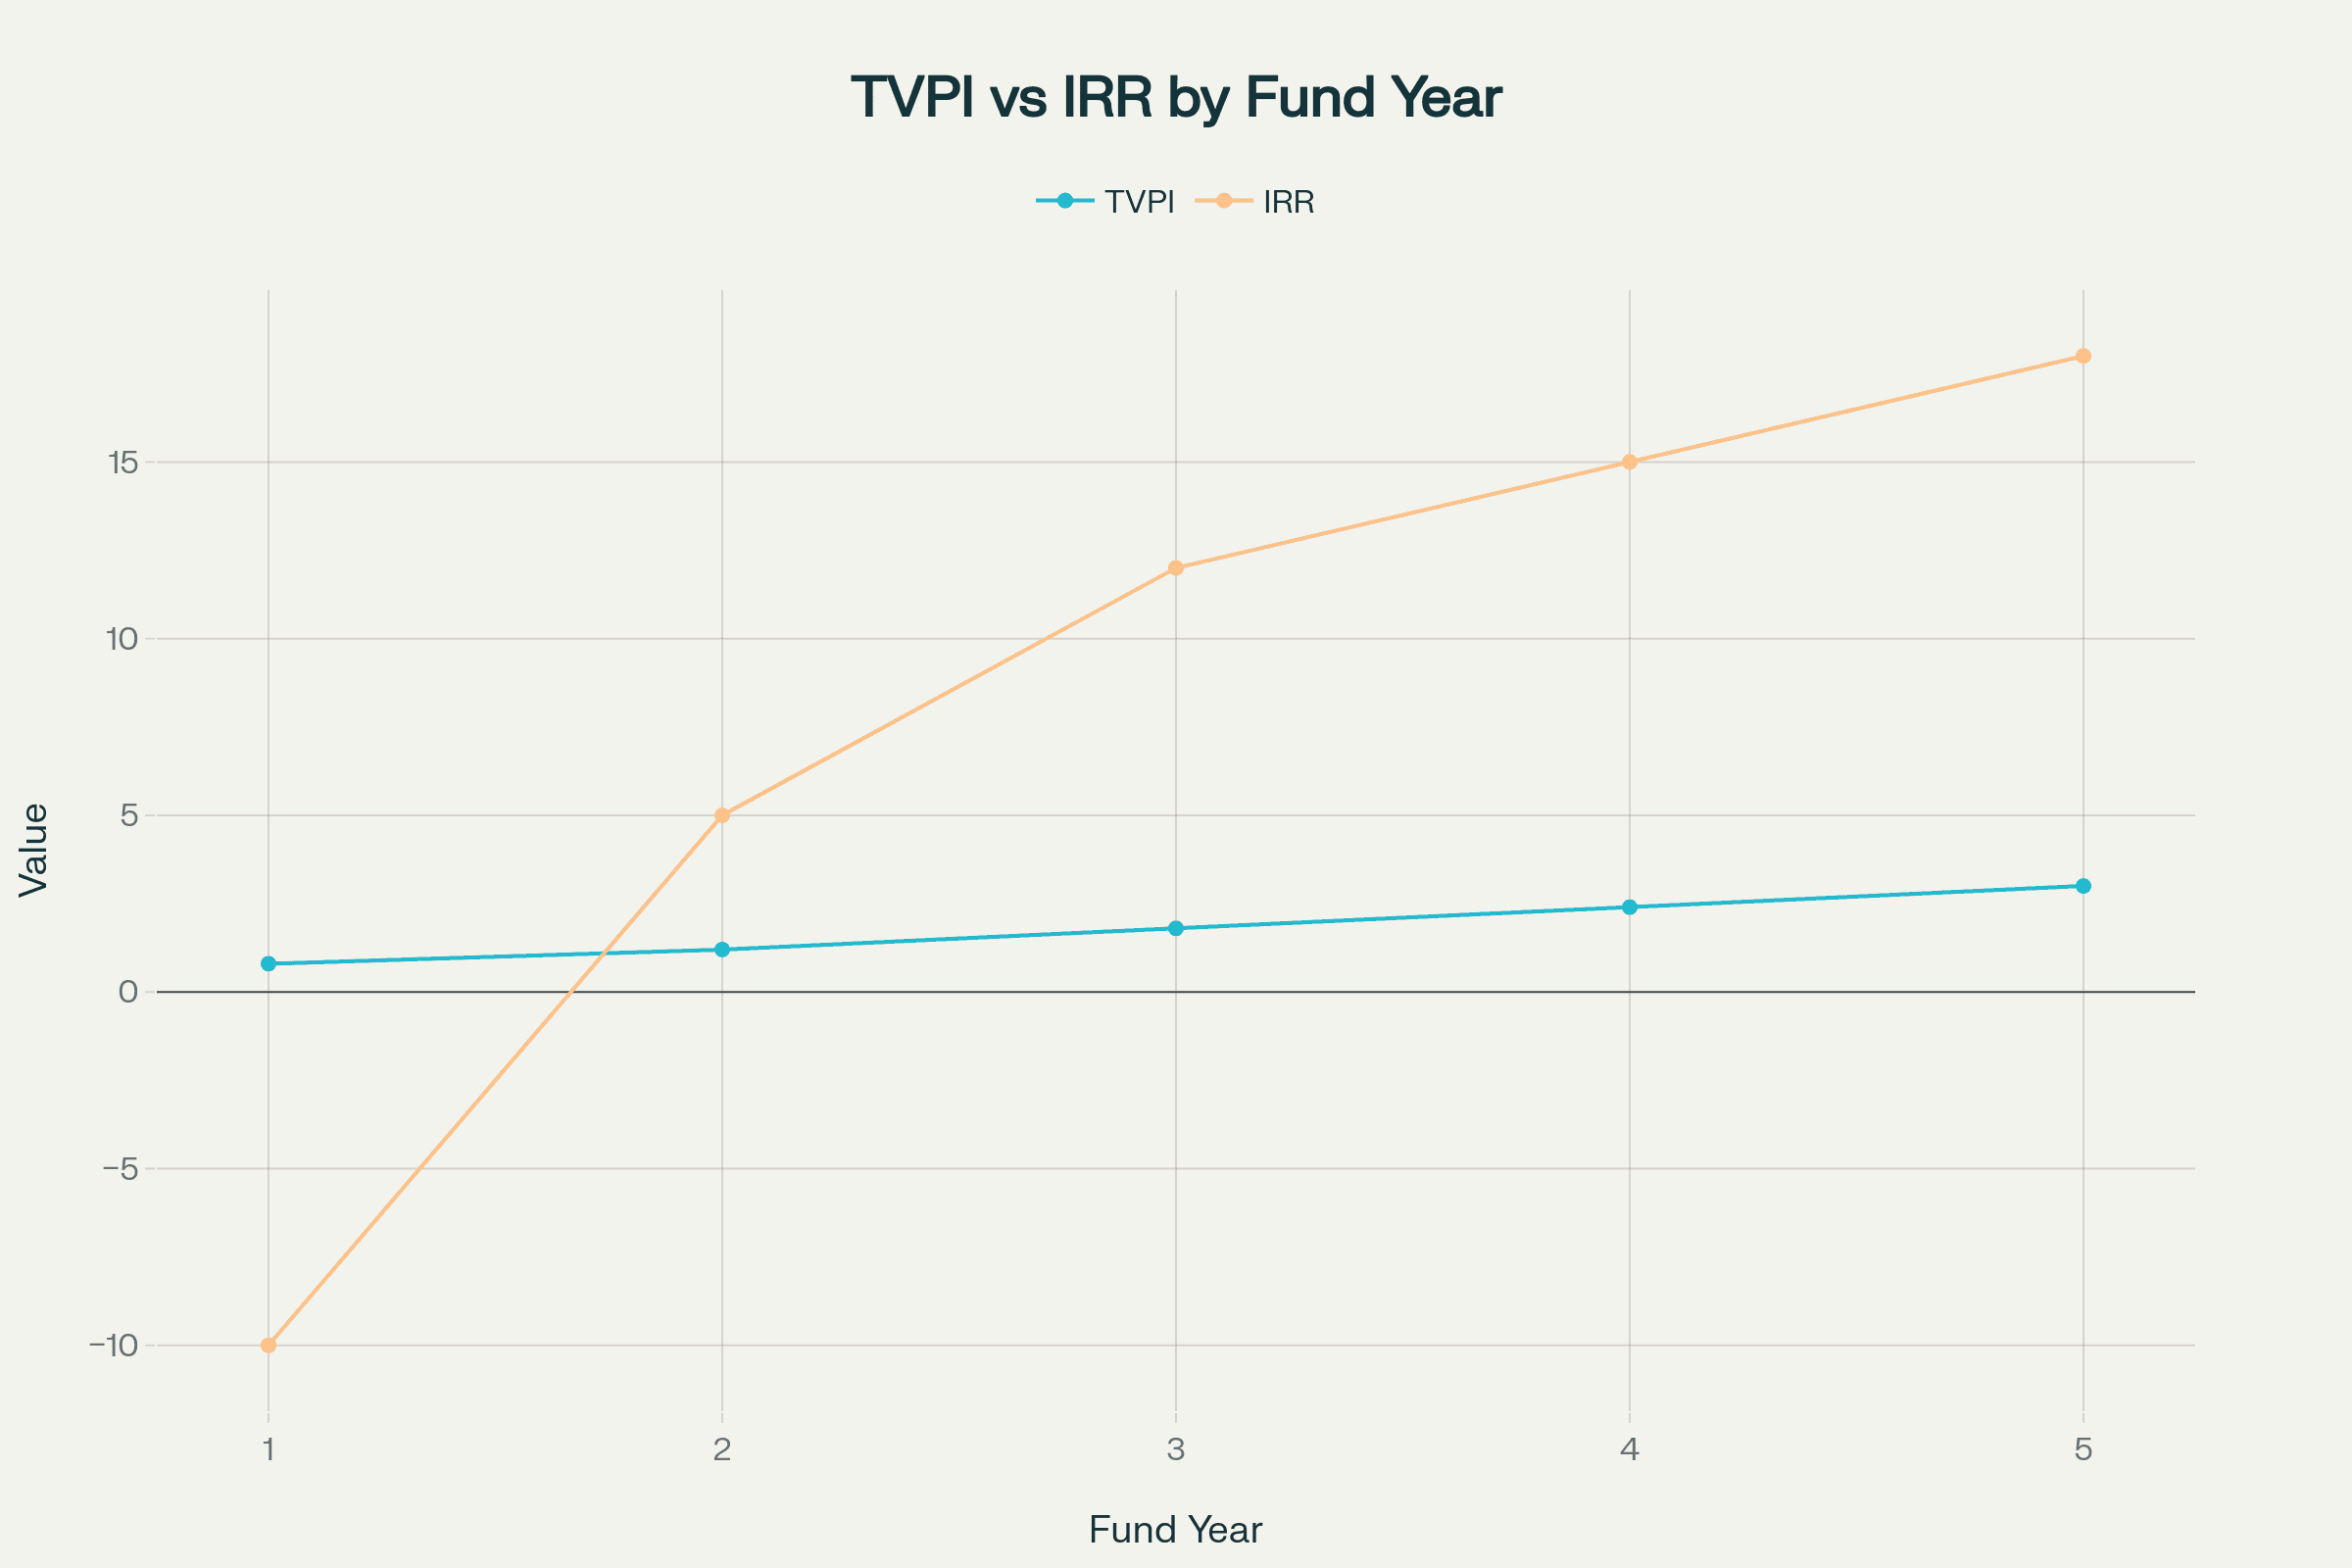
While Internal Rate of Return (IRR) measures annualized returns considering timing, TVPI focuses purely on value creation:
- IRR advantages: Accounts for time value of money, enables comparison across different holding periods
- TVPI advantages: Simple to understand, less susceptible to manipulation through timing, provides clear value snapshot
A fund might show strong IRR through quick exits but modest TVPI, or vice versa with patient value creation.
TVPI vs DPI
DPI only measures actual cash returned, while TVPI includes unrealized gains:
- Early in fund life: TVPI typically exceeds DPI as portfolio companies grow
- Later stages: DPI approaches TVPI as investments are realized
- Fund maturity: DPI equals TVPI when all investments exit
TVPI vs MOIC
Multiple on Invested Capital (MOIC) and TVPI are often used interchangeably, though technically:
- MOIC: Typically refers to individual investment multiples
- TVPI: Standard term for fund-level performance
Industry Benchmarks and Expectations
Venture Capital TVPI Benchmarks
Recent data reveals significant variations in VC fund performance by vintage and size:
By Vintage Year (Top Decile Performance):
- 2017 vintage: 3.46x current TVPI
- 2018 vintage: 2.86x current TVPI
- 2019 vintage: 2.22x current TVPI
- 2020 vintage: 1.88x current TVPI
- 2021 vintage: 1.33x current TVPI
By Fund Size (2018 Vintage, 90th Percentile):
- $1-10M funds: 4.03x TVPI
- $10-50M funds: 2.86x TVPI
- $50-100M funds: 2.41x TVPI
- $100M+ funds: 1.67x TVPI
This demonstrates the power law in venture capital, where smaller funds can achieve more concentrated exposure to breakout companies.
Private Equity TVPI Benchmarks
PE funds typically show lower but more consistent TVPI multiples:
European Buyout Performance:
- Since-inception pooled TVPI: 1.72x (vs 1.20x for MSCI Europe)
- Top quartile mature funds: 2.0x - 2.6x
- Median mature funds: 1.5x - 1.8x
- Bottom quartile: Below 1.3x
By Investment Size:
- Large PE: Highest absolute returns with superior DPI
- Mid-market PE: 16.55% IRR, outperforming public markets by 973 bps
- Small PE: More modest but positive returns
Crisis Vintage Performance:
- Post-2008 crisis vintages (2009-2015): 2.7x TVPI for mature VC funds
- Recent vintages (2016-2020): 1.3x TVPI (shorter realization period)
J-Curve Dynamics and TVPI Evolution
TVPI follows a predictable pattern throughout a fund's lifecycle, forming the classic J-curve:
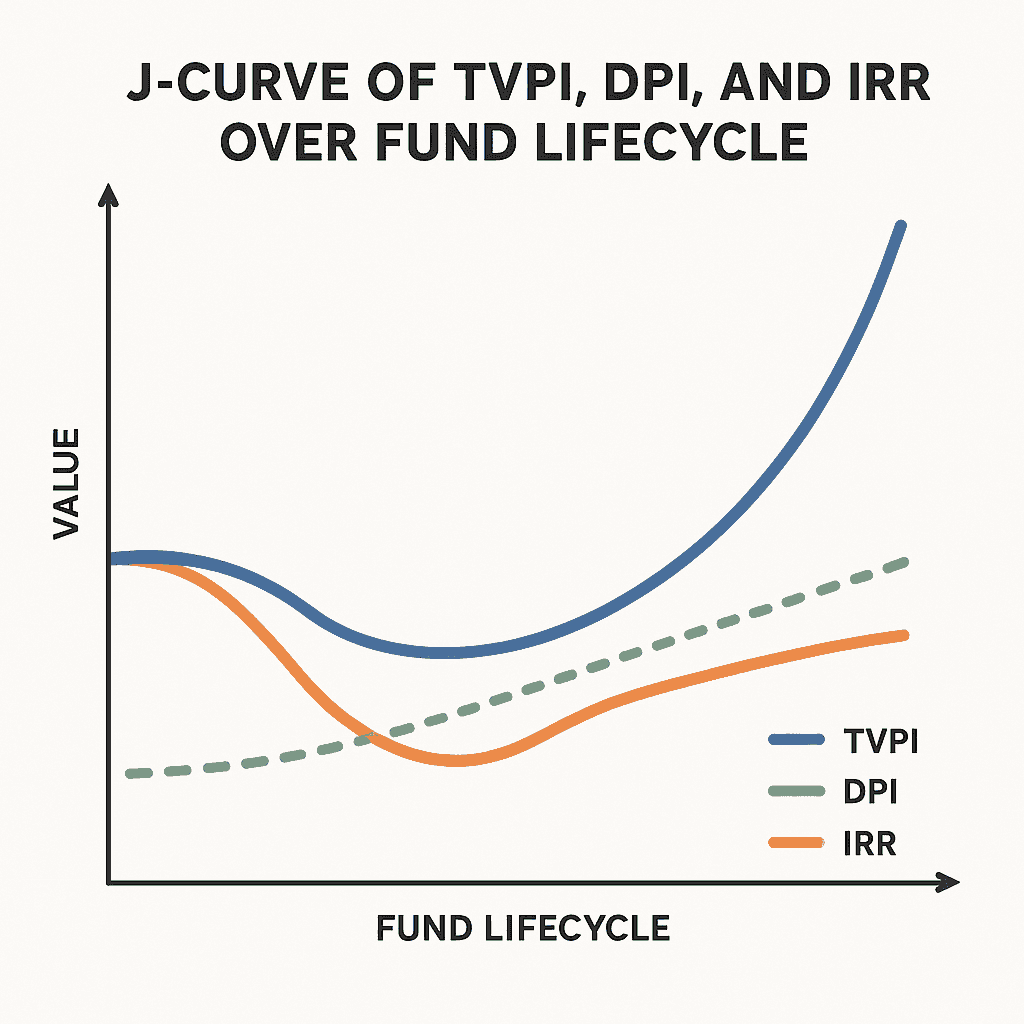
Years 1-3: TVPI typically falls below 1.0x as:
- Management fees consume 6-8% of committed capital
- Early investments are marked conservatively
- No meaningful exits have occurred
Years 4-6: TVPI begins climbing above break-even as:
- Portfolio companies mature and receive mark-ups
- Initial exits provide early DPI
- RVPI component peaks
Years 7-10: TVPI accelerates through:
- Major exits converting RVPI to DPI
- Proven winners achieving significant multiples
- Late-stage value creation
Years 10+: TVPI stabilizes as:
- RVPI approaches zero
- DPI converges with TVPI
- Final portfolio liquidation
Practical Applications of TVPI
For Limited Partners
LPs use TVPI to:
- Track Record Analysis: Only 19% of top-quartile buyout funds repeat this performance in subsequent funds, making historical TVPI analysis critical but not deterministic
- NAV Scrutiny: Research shows NAVs may be inflated during fundraising periods, requiring careful evaluation of the RVPI component
- Portfolio Construction: Balance exposure across different J-curve stages to manage liquidity
- Stress Testing: Apply haircuts to RVPI when unrealized value exceeds 70% of TVPI
For General Partners
GPs leverage TVPI for:
- Fundraising: Demonstrate value creation through net TVPI (after fees and carry)
- Performance Attribution: Distinguish operational improvements from financial engineering
- LP Communications: Present integrated dashboards showing TVPI alongside DPI, RVPI, and IRR
- Capital Call Timing: Manage denominator effects through strategic pacing
Investment Committee Best Practices
Modern investment committees employ sophisticated TVPI analysis:
- Consensus Requirements: 76% of PE organizations require consensus voting, with TVPI as a key metric
- Sensitivity Analysis: Model TVPI under various exit scenarios and valuation compressions
- Public Market Equivalents: Compare TVPI performance to PME benchmarks
- Deal Exclusion Analysis: Understand which investments drive fund-level TVPI
Limitations to Consider
- Valuation Dependency: Unrealized values rely on subjective methodologies vulnerable to optimism bias
- Time Agnostic: A 2.0x TVPI after 3 years vastly outperforms the same multiple after 10 years
- J-Curve Misinterpretation: Early negative TVPI is expected, not indicative of poor performance
- Market Timing Sensitivity: Bull markets inflate RVPI; bear markets compress exit multiples
- Denominator Manipulation: Aggressive capital call pacing can artificially boost TVPI
TVPI Calculation Deep Dive
The Core Formula
TVPI = (Cumulative Distributions + Residual Value) / Paid-In Capital
Breaking this down:
- Cumulative Distributions: All cash and stock returned to LPs
- Residual Value: Fair market value of remaining holdings
- Paid-In Capital: Actual capital contributed (not committed)
Net vs Gross TVPI
The distinction between net and gross TVPI is crucial:
Net TVPI = (Total Value - Management Fees - Carried Interest) / Capital Called
Industry standard reporting uses net TVPI to reflect actual LP returns after all costs. Gross TVPI overstates returns and should be avoided in LP communications.
Component Relationship
TVPI mathematically equals the sum of its parts:
TVPI = DPI + RVPI
This relationship enables powerful diagnostic analysis:
- High TVPI with low DPI signals realization risk
- DPI approaching TVPI indicates mature fund nearing liquidation
- RVPI exceeding DPI warrants valuation scrutiny
Best Practices for TVPI Analysis
Contextual Evaluation
Never evaluate TVPI in isolation. Consider:
- Fund vintage year and corresponding market cycles
- Strategy-specific benchmarks (VC vs PE vs Growth)
- Geographic and sector focus impact on multiples
- Fund size relative to strategy (smaller funds often achieve higher multiples)
- Time elapsed since first capital call
Trajectory Analysis
Track TVPI progression using milestone expectations:
- Year 2: Expect 0.7-0.9x due to fees and J-curve
- Year 5: Target 1.3-1.8x with portfolio maturation
- Year 8: Seek 2.0x+ as exits accelerate
- Year 10+: Evaluate final multiple vs vintage peers
Monitor the slope of TVPI growth—acceleration indicates value creation momentum.
Valuation Scrutiny
When RVPI dominates TVPI (>70%), conduct enhanced diligence:
- Review valuation methodology consistency
- Compare marks to public market comparables
- Assess concentration in top holdings
- Evaluate near-term exit pipeline
- Apply conservative haircuts for scenario planning
Integrated Performance Framework
Adopt a comprehensive dashboard approach:
- Net TVPI: Overall value creation multiple
- DPI: Realized return validation
- RVPI: Future value potential
- IRR: Time-adjusted performance
- PME: Public market comparison
- Quartile Ranking: Peer positioning
This multi-metric view prevents over-reliance on any single measure and enables nuanced performance assessment.
Common Questions About TVPI
What is considered a good TVPI for different fund types?
For venture capital funds, a mature fund TVPI above 3.0x places it in the top quartile, while 2.0-2.5x represents solid median performance. Private equity funds typically target lower multiples, with 2.0x+ considered top-quartile performance. Growth equity funds usually fall between these ranges, targeting 2.0-3.0x TVPI at maturity.
How does TVPI change throughout a fund's lifecycle?
TVPI typically follows a predictable pattern: starting below 1.0x due to management fees and early investments, gradually increasing as portfolio companies mature and valuations rise, accelerating in years 5-8 as exits begin, and ultimately converging with DPI as the fund fully liquidates. The pace varies significantly by strategy and market conditions.
Can TVPI decrease over time?
Yes, TVPI can decline if portfolio company valuations are marked down, exits occur below carrying values, or write-offs exceed new value creation. This is particularly common during market corrections when unrealized valuations compress, or when promising companies fail to meet growth expectations.
How reliable is TVPI for funds with high unrealized value?
TVPI becomes more reliable as the DPI component increases through realized exits. For funds with RVPI comprising over 70% of TVPI, investors should scrutinize valuation methodologies, consider market conditions, and assess the likelihood of achieving marked values. Conservative investors might apply haircuts to RVPI when evaluating true performance.
Should investors prioritize TVPI or IRR when evaluating funds?
Both metrics serve different purposes and should be evaluated together. TVPI shows absolute value creation ability, while IRR reflects time-adjusted returns. A fund with high TVPI but low IRR may indicate slow value realization, while high IRR with modest TVPI might suggest quick but limited value creation. Institutional investors typically set minimum thresholds for both metrics.
Conclusion
Total Value to Paid-In Capital remains the gold standard for measuring private market fund performance. While it doesn't capture the time dimension of returns like IRR, TVPI provides the clearest picture of a fund's value creation capabilities. Understanding its components, limitations, and proper application enables both LPs and GPs to make more informed decisions throughout the investment lifecycle.
For investors evaluating fund opportunities, TVPI serves as an essential benchmark, but remember that past TVPI performance doesn't guarantee future results. The key lies in understanding what drives TVPI for different strategies, maintaining realistic expectations based on market conditions, and always evaluating TVPI alongside other performance metrics for a complete picture of fund performance.